Over the years, Jeff has accurately predicted major market ebbs and flows. He’s been spot-on with everything from the crash of March 2020, to the meteoric rise in precious metals prices in 2024.
← Back to Powerful Market Insights“Within the economic pattern of a period, the tidal ebb and flow of mass psychology in response to the rhythms of environmental change cannot be safely disregarded…Man is, apparently, not so greatly dissociated as he had supposed, from the source of all that enables him to live.”
-Edgar Lawrence Smith
“I hear you talking when I’m on the street
You mouth don’t move but I can hear you speak.”
–The Rolling Stones, Rocks Off
“You know, life’s a funny thing. Nobody wants to get old, but nobody wants to die young either.”
-Keith Richards
The market’s a funny thing. It wants to get old, but it often dies young…just went it looks like it’s broken out…like Octobear 2007, like Octobear 2021, like August 2018, like July 1990.
So the question is whether the breakage over the high of January 2 years ago is the real deal or a Bull Trap.
In this report we’ll take a look at the current complexion of the market through Time and Price, the Lennon and McCartney of trading.
But first, for those of you that don’t know who I am, I started my career as one of the youngest brokers ever hired at the famous Drexel Burnham Beverly Hills office.
After I left, I worked with my dad at his private hedge fund.
When he retired in the late 1980’s, I went on to become a day trader and swing trader.
I wrote two Hit and Run Trading books in the late 1990’s and started the daily Hit and Run Reports in 1996.
I have known many great traders and many fake traders.
I have known many traders who have made millions trading and give it all back once the cycles turned.
Once the market changed its complexion, the strategies they used that worked for particular patterns failed.
Breakouts failed, indicators became too overbought or oversold: the same indicators that work in bull markets don’t necessarily work in bear markets…and vice versa.
This is one of the blaring sirens that the character of the market has changed..
The vast majority of these individuals who made millions gave it all back.
What gives me the most satisfaction of continuing to write my reports is to help people avoid these pitfalls.
My object is to shine a light on what you don’t know you don’t know.
Said another way, in markets it’s not what you don’t know that can hurt you, but rather what you thought you did know.
What I do NOT use in trading are indicators.
Indicators are descriptive not predictive.
Almost all indicators are derived from Price or Price and Volume.
They are of second degree magnitude. Why not go right to the horse’s mouth so to speak:
Price and Time.
Moreover, most all indicators do not use Time and as W.D. Gann wrote, “Time is more important than price.”
I use Time and Price and the Patterns that the two produce.
My methods are based largely on pattern recognition in conjunction with Cycles of Time and Price.
Let’s take a look at Time Cycles from 1900.
I am using a 13 year cycle (that does not mean exactly 13 years to the month).
Why 13 years?
First an empirical look at the history of the market shows apx 13 years is important.
Second 13 is the SEVENTH number in the Fibonacci seuquence:
1,1,2,3,5,8,13.
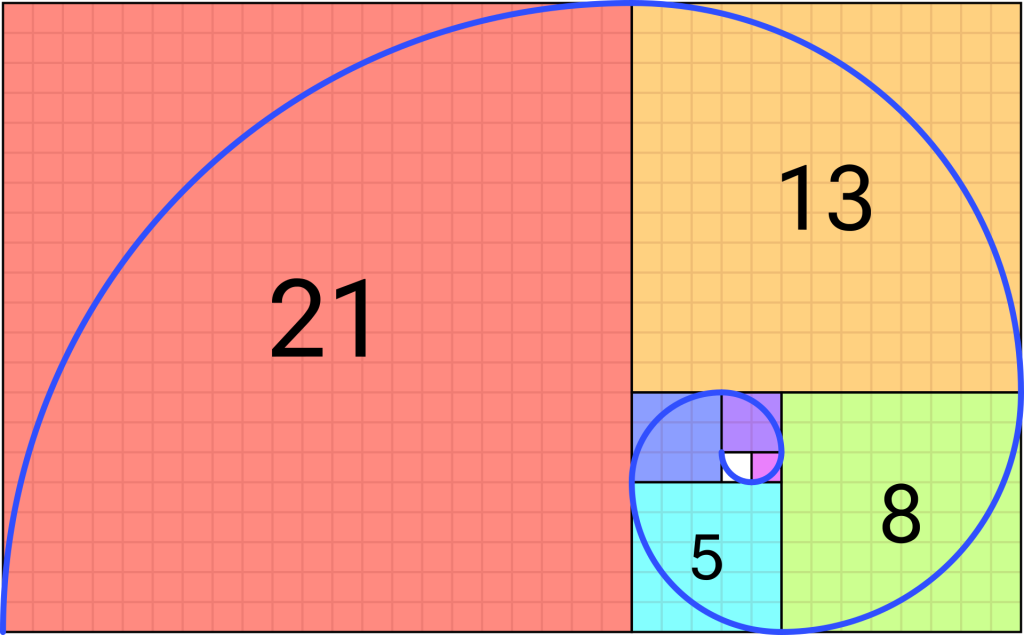
As W.D. Gann wrote 7 is the number of time. 7 is the fatal number.
The chart below is the DJIA from 1900.
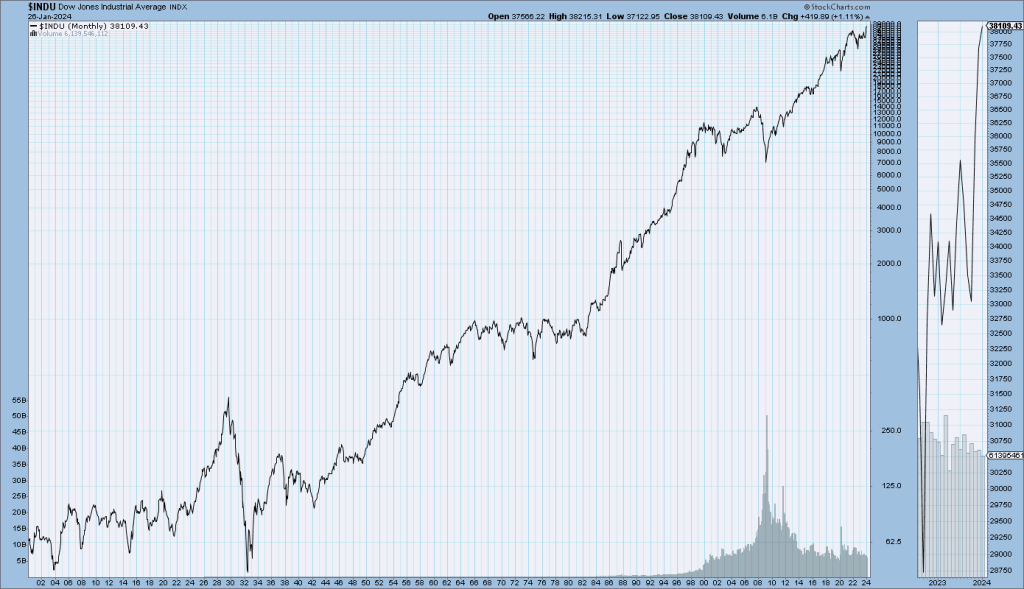
From a high in 1901 the DJIA crashed into 1903.
13 years from 1901 is 1914 and the start of WW1.
In 1914 the market collapses and shuts down.
13 years from 1914 is 1927..
The market explodes out of a monthly Cup and Handle in April 1927 on its final run to its 25 year top in 1929.
The low of the Handle was OCTOBEAR 1926, so the melt up was 3 years.
13 years from 1927 is 1940.
April (again) 1940 a crash starts. It sets the stage for a major undercut low in 1949.
13 years forward is 1953.
Check out Sept/October 1953 low and the explosion higher.
13 years forward is 1966.
Jan/Feb 1966 is a major top (as the November 1972 to January 1973 spikewas a major false breakout).
13 years later is 1979 Octobear/November low with an undercut low in March 1980 for the start of a major rally (mirroring November 2008 low and March 2009 undercut low).
13 years forward is 1992 which starts a 1 year Line Formation and high level consolidation.
That the market didn’t shake-out in this cycle underscored the door was open for much higher.
13 years late is 2005 and another Octobear low and blast off.
13 years later is October 2018 and the start of the 2018 Christmas Crash.
Cycles overlap concurrently which makes interpreting them an art.
In other words there are multiple cycles working themselves out in tandem…like a double helix.
Below is an overlapping 13 year cycle to the above turning points.
From the major October/November 1903 low the market exploded into November 1916.
November 1916 + 13 years gives the fall of 1929. The low close of the crash occurred in November 1929 (not the low of the bear market).
1929 + 13 years is 1942 and a major low in April.
1942 + 13 years is 1955 when the DJIA finally eclipses its 1929 high.
1955 + 13 is 1968, a major peak followed by a crash into May 1970.
1968 + 13 years = 1981.
April 1981 was a high preceding the drop into the major August 1982 bull market blast off.
1981 is the mid-point between the major 1980 low and the major 1982 low.
1981 + 13 years gives 1994.
In November 1994 the DJIA carves out a low prior to a 5 year run for the roses.
1994 + 13 years is 2007 and the top preceding the Great Recession.
2007 + 13 years is 2020 and a crash.
When the pre-crash high from 2020 was reclaimed the market exploded into the end of 2021 for a major top.
The drop into October 2022 backtested the pre-crash highs in early 2020.
13 years from 2020 will mark an important cycle in 2033.
Likewise, 13 years from the Volumgeddon Top in January 2018 gives 2031.
The mid-point between these cycles is 2032 and the 100 year anniversary of the 1932 low.
Expect fireworks over the next 7 years.
A weekly SPX below shows why the current breakout is suspect.
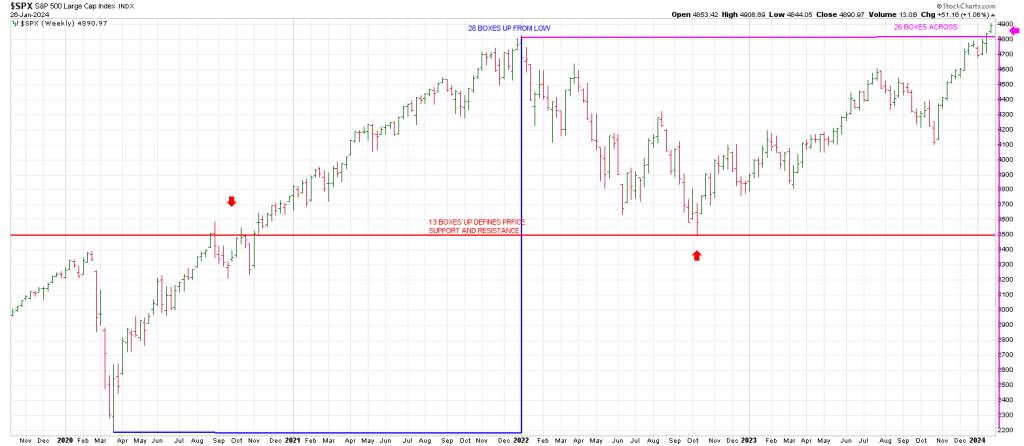
The vertical magenta line represents a square-out of the range from the March 2020 low to the January 2022 top.
Allow me to explain.
I measured up from the low of 2020 to the top in 2022 and took the same space across in time.
It ties to this week, when most of the big cap Mega Techs report.
Proving the geometry of the market is that the mid point of the vertical blue line has defined consequential support and resistance.
Notice how the October 2022 low is a direct hit.
“There is a definite relation between price and time. By studying time cycles and time periods you will learn why market tops and bottoms are found at certain times, and why resistance levels are so strong at certain times, and prices hold around them. The most money is made when fast moves and extreme fluctuations occur at the end of major cycles.”
-W.D. Gann
Gann speaks of time cycles and time periods.
There are natural cycles and market cycles.
Gann believed market cycles can be determined by the geometry of the 360 degree circle or cycle.
This is 3 + 6 + 0 or Nicola Tesla’s 3, 6, 9 secret of the universe.
Below I have taken some of the natural divisions of the circle counting from both the SPX January 4, 2022 high and the October 13, 2022 low.
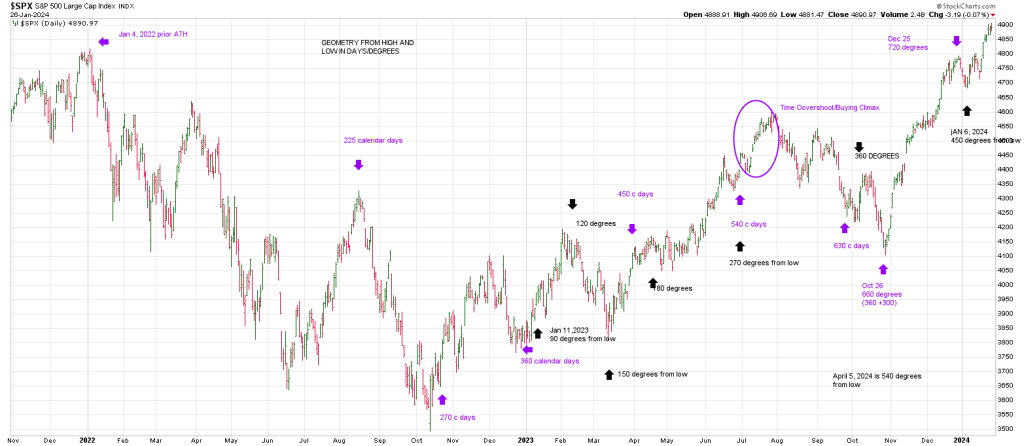
Notably, the SPX struck a low on January 5, 2024 which is 720 degrees days (360 X 2) from the Jan 4, 2022 ATH.
The Jan 5, 2024 low perpetuated a momentum move to all time new highs.
That said the SPX may be tracing out a Gann M A Top as shown in this space last week.
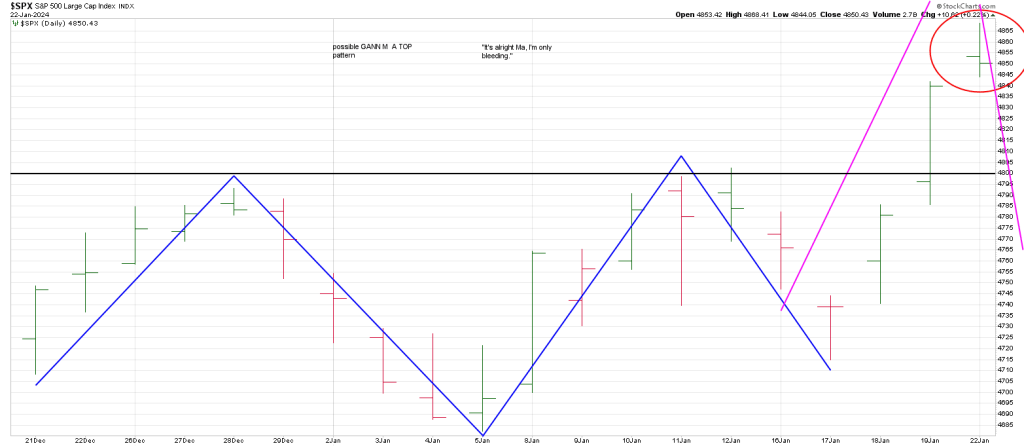
Breakage back below the peaks of the M around 4798 is a yellow flag.
Breakage below the feet of the M (4717) is a red flag.
There is the way the market can speak to us using geometry of Time & Price.
One of the ways it speaks is through the Wheel of Time and Price which integrates time and price defining turning points.
Above I mentioned the major cycle from 1929 and 1932.
1932 is 92 years ago.
On the “Wheel” 92 is 180 degrees opposition the end of last week.
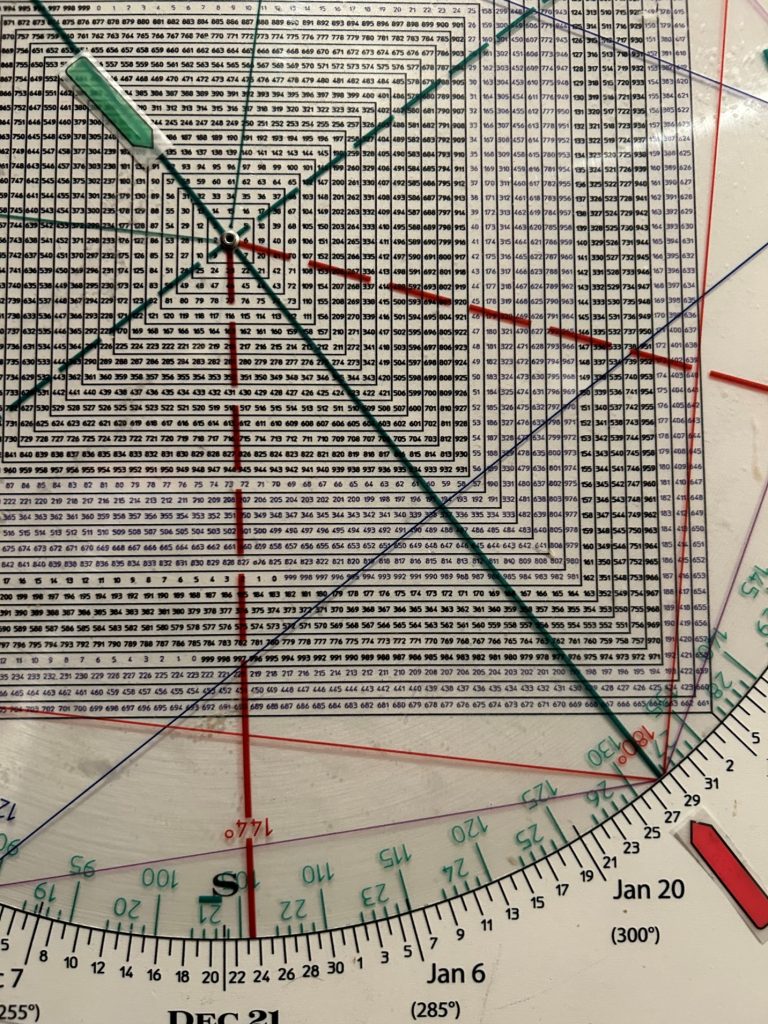
Green is 92
Red is January 27th.
While many market participants believe a new bull market started in October 2023 due to the momentum or even October 2022, remember Gann’s quote above about fast moves at the end of major cycles.
The market should respect the current time and price cycles.
Why?
The Square of 9 Wheel image below shows a T Square with 489.
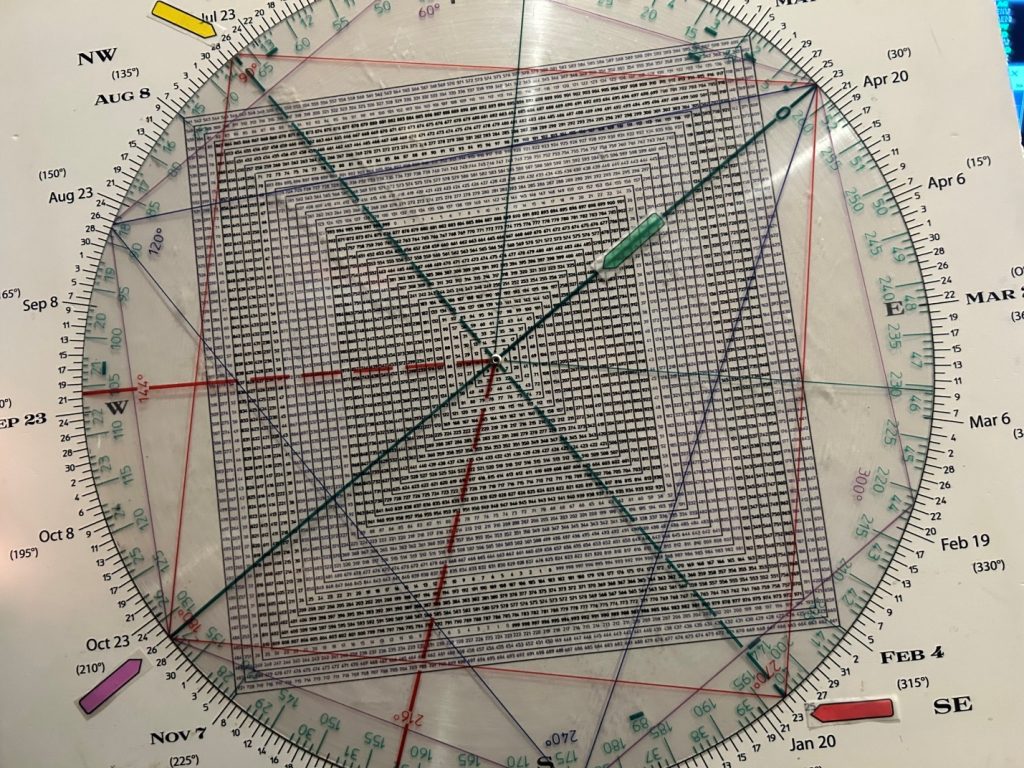
1) 489 (SPY) squares late January.
2) 489 squares the late July 2023 high time
3) 489 is opposite the October ]low time.
In sum, we’re at the upside pivot; however, if a turn down doesn’t take place over the next week or two and from around current levels, it opens the door for meltup “potential.”
The fast move at the end of a major cycle may morph into a larger crescendo.
Never say never. That said the important take away is that this is not a new bull market and while breadth is the most negative at new all-time highs in history, breadth is not a timing indicator and exuberance can get more irrational than expected at the end of a cycle that culminates runs from 1932, 1982 and 2009.
