“One of the important factors behind the fluctuation between bull and bear markets, between booms and crashes and bubbles, is that investor memory has to fail us—and fail universally—in order for extremes to be reached.” Howard Marks
“You make me feel like I can fly
So high, elevation.” Elevation, U2
“Record numbers of US executives are selling shares in their companies. The ratio of insider sales-to-insider buys has hit a record high for any quarter in two decades.” Financial Times
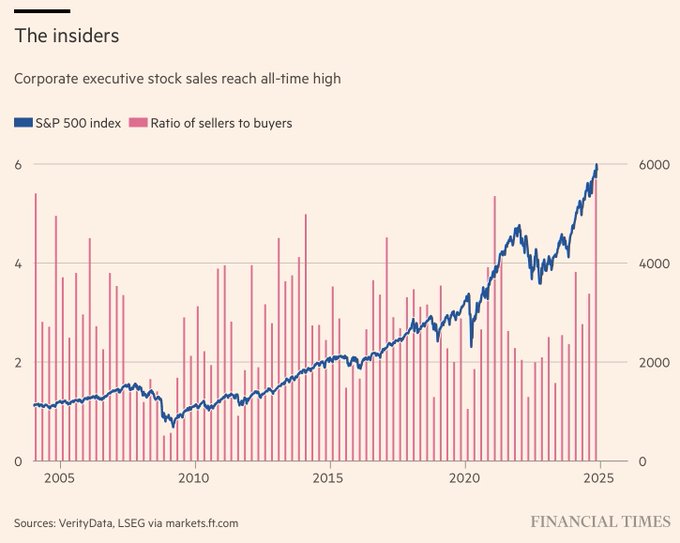
Whether this reflects insider concern about future earnings trends or quality of earnings, is irrelevant: they’re sellers.
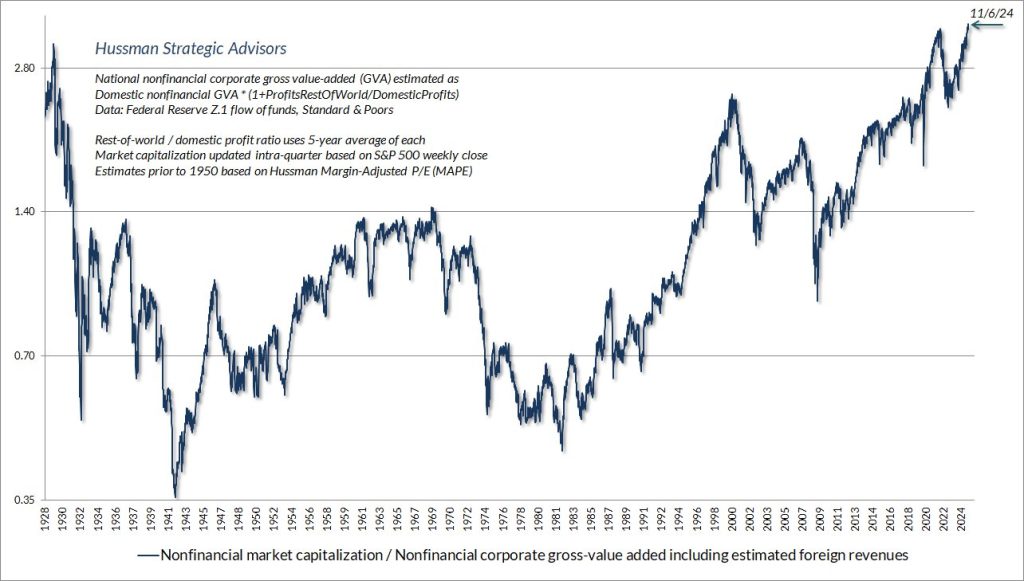
When you combine this fact with John Hussman showcasing that last weeks record high attended the most extreme level of valuation in U.S. history, the market is presenting a strong warning to you.
What’s driving the recent stampede then?
- Performance chasing by money managers in the last quarter
- the publics love affair with stocks.
Re 1) The SPX broke out of a monthly Cup and Handle formation in January 2024 triggering a 1200 point, 25% advance this year.
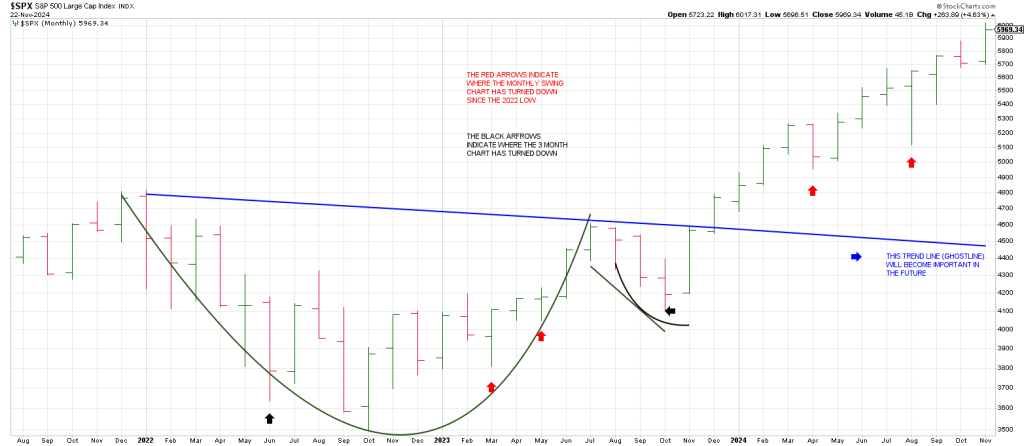
Notice the Monthly Swing Chart has turned down only twice during this year’s powerful rally.
In other words it has only traded below a prior months low on two occasions this year:
In April and again in August.
Notice that after the October 2022 low, each monthly turndown defined a low…until 2023 when we got 3 consecutive lower monthly lows.
If you’re a money manager and you haven’t beaten the benchmark SPX, or worse yet your competition, you have to chase for performance with weeks remaining until year end.
It’s all about assets under management.
There’s nothing worse for a money manager than to be outdone by their competition and risk losing assets under management.
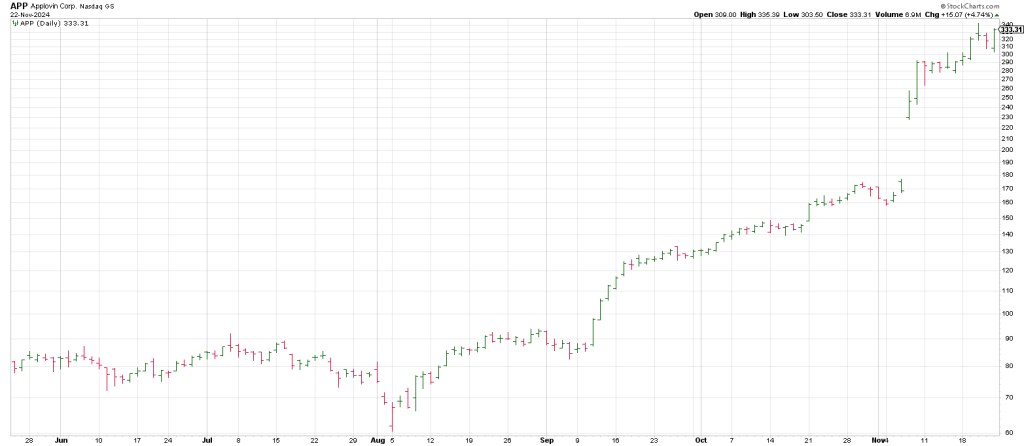
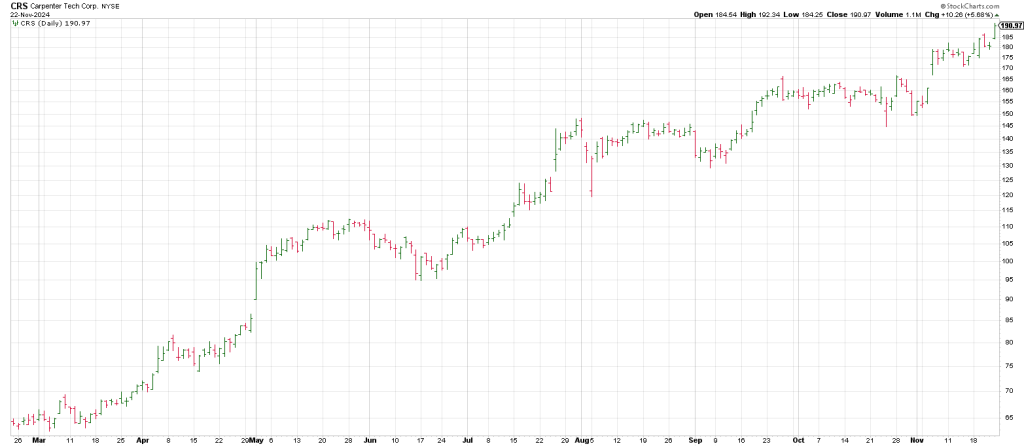
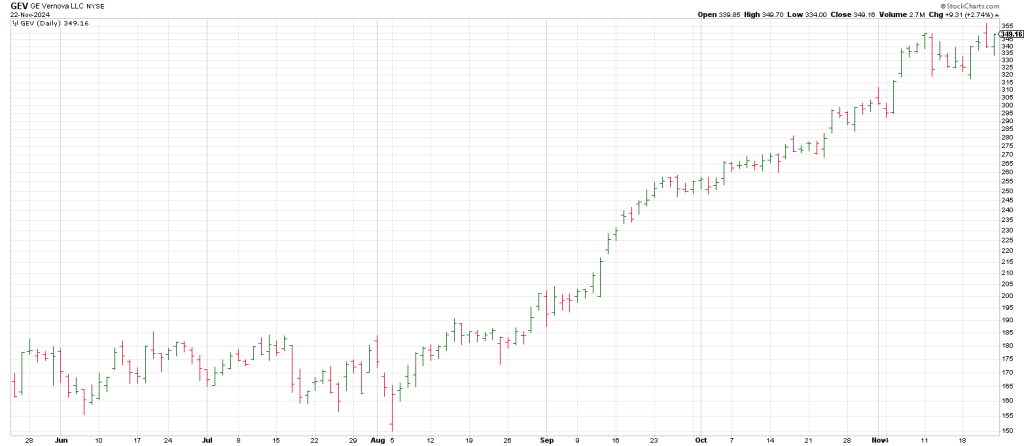
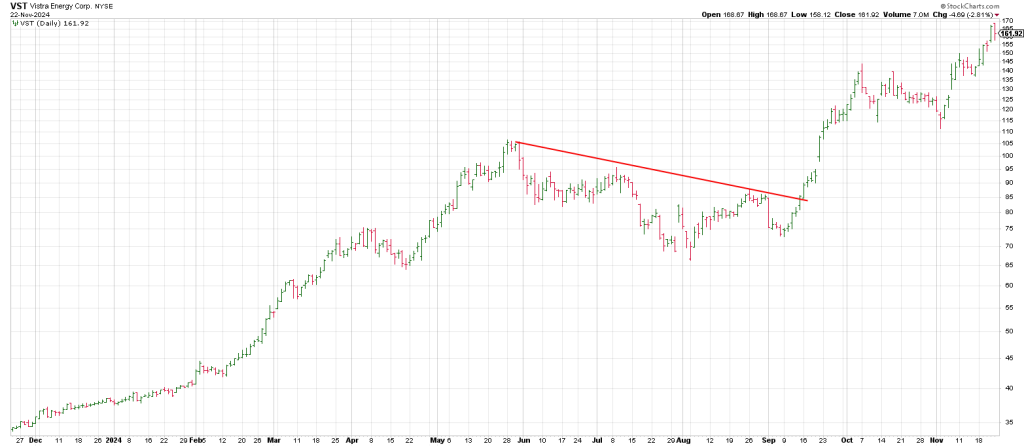
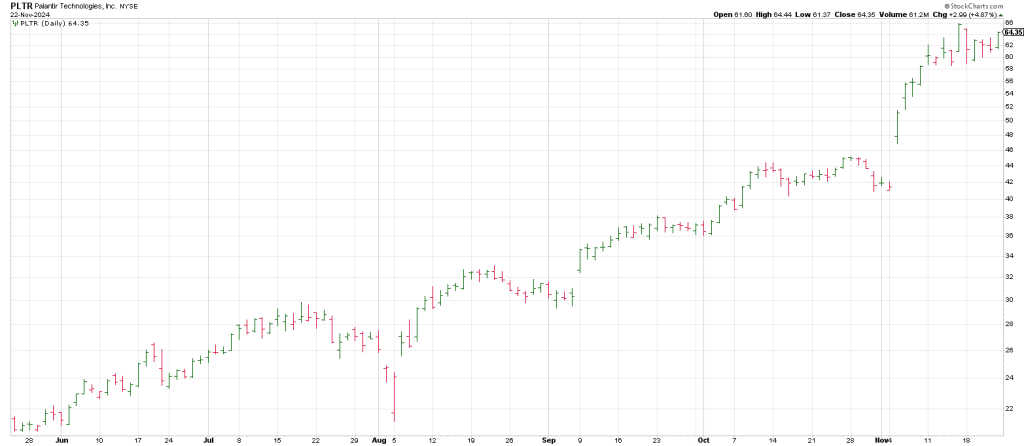
When you see a segment of stocks going vertical it’s because these winners are being turbo charged by performance chasing.
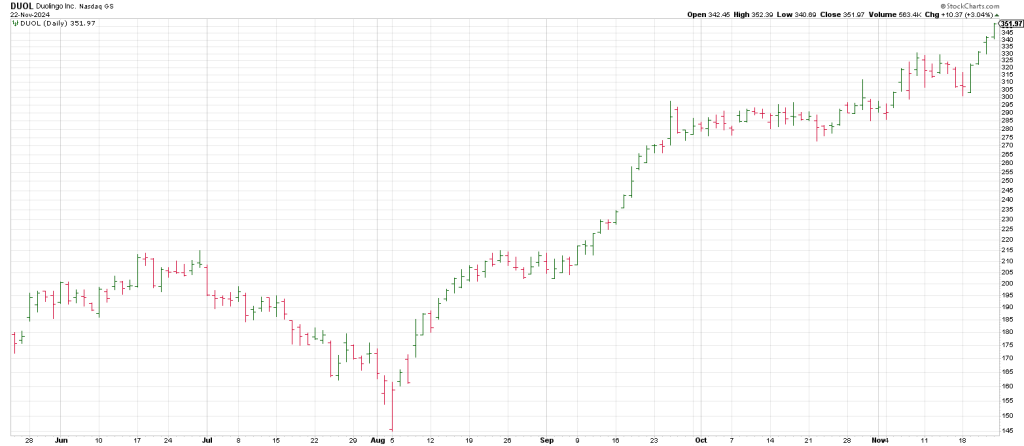
It’s the new Nifty Fifty with names like APP, CRS, GEV, VST, PLTR and DUOL to mention a few.
Re 2) A chart of the Conference Board Consumer Confidence survey shows the public’s consensus for a rising stock market has more than doubled in the last two years to an all-time high. In a word, the public is euphoric for stocks.
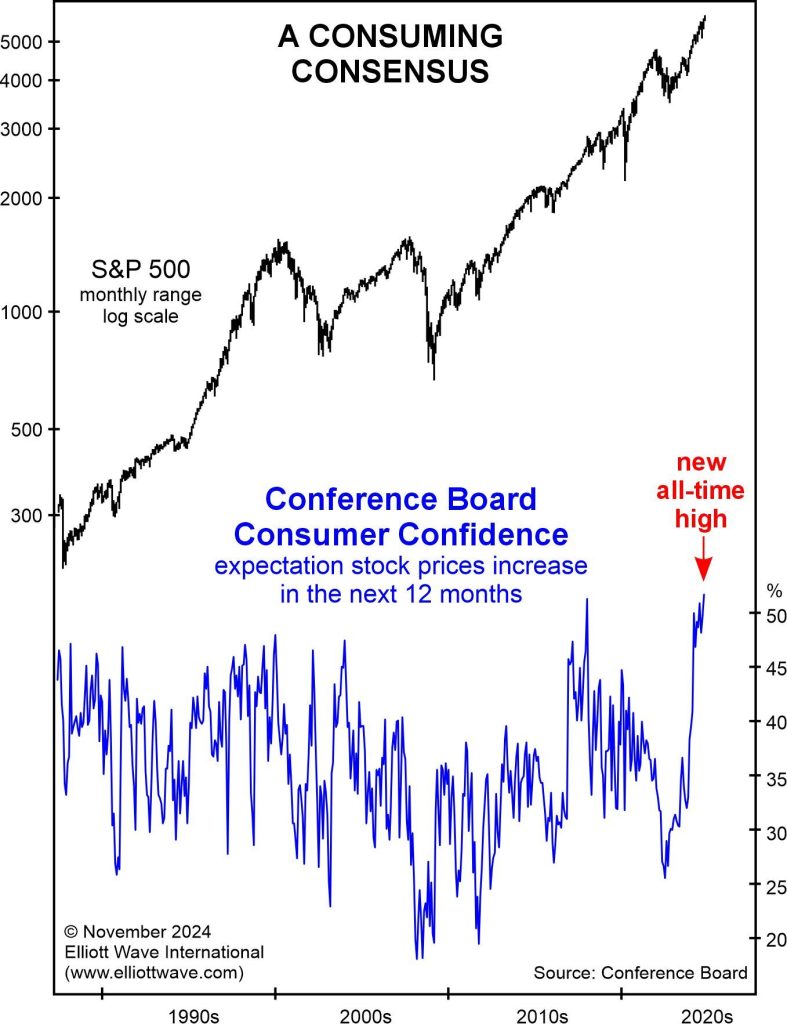
Retail investors are speculating on a rising stock market more intensely that 1999, Investors are in head over heels on stocks. And as love affairs go, the bloom comes off the rose
The last generation of investors have been taught that the harder the market falls, the stronger the bull charges back.
1987
2000-2002
2008
2018
2020-Covid. Covid was a particularly exceptional comeback. The market’s entire reaction to a pandemic was wiped out in a matter of months with the SPX up a 100% off the Covid lows in a astonishing 16 months.
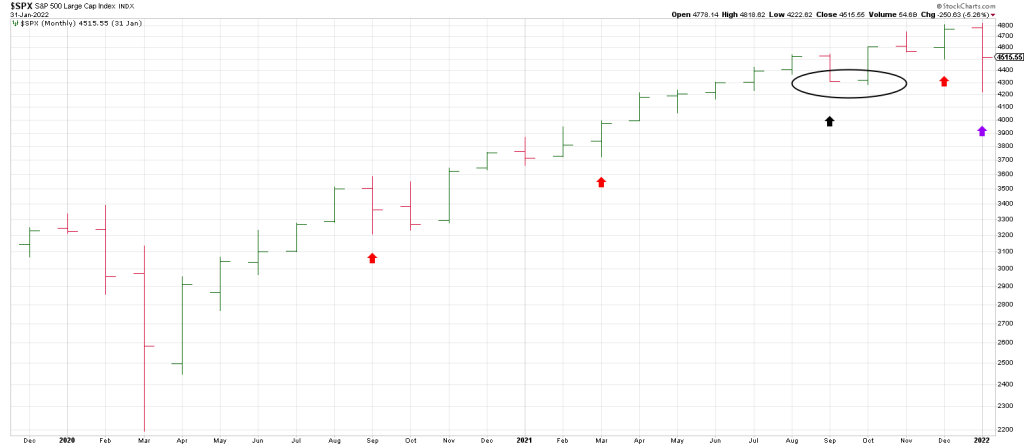
In the entire advance, the SPX never traded more than one month below a prior months low—
Except once..and that was in October 2021 and lasted a few days.
Those two lower monthly lows in September and October 2021 satisfied my Plus One/Minus Two buy setup…on the monthly basis.
The most recent episode of Mr. Market’s comeback following the 2022 bear mirrors the runaway move from April 2020 through November 2021.
The advance from the October 2022 low is 100 points shy of a perfected Measured Move.
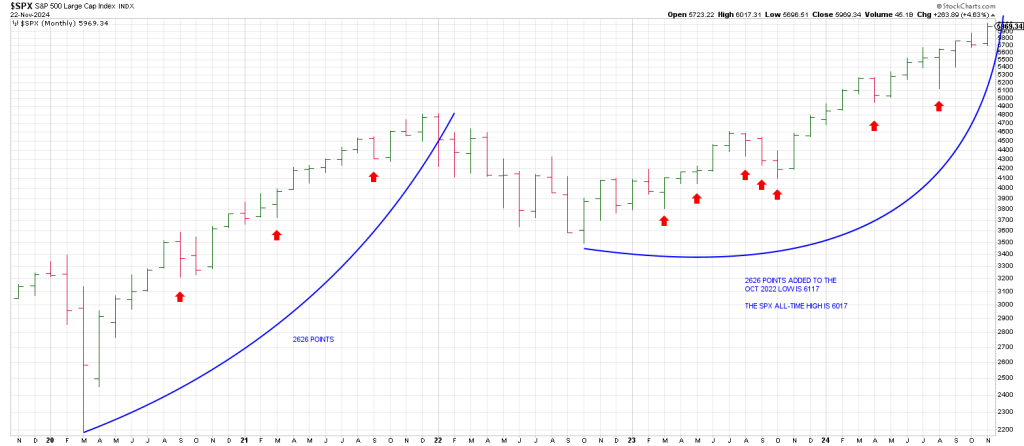
Following the October 2022 low each turndown in the Monthly SPX Swing Chart defined a low (red arrows).
The exception was the decline into the October 2023 low which satisfied a turn down in the 3 Month Chart with 3 consecutive lower monthly lows.
This also put in the Handle of a monthly Cup and Handle.
Together these two factors perpetuated a one year runaway move that has money managers backs up against the performance wall.
Each subsequent turndown in the monthlies after the October 2023 bottom defined a low, albeit the August turn down produced Airpocketism. Be that as it may the close at the highs of the month in August indicated the drop was a shake-out opening the door to higher prices
The bottom line is a turndown in the SPX 3 Month Chart is a rare bird.
Let’s review the price action when the 3 Month Chart has turned down since the March 2000 top and what it meant.
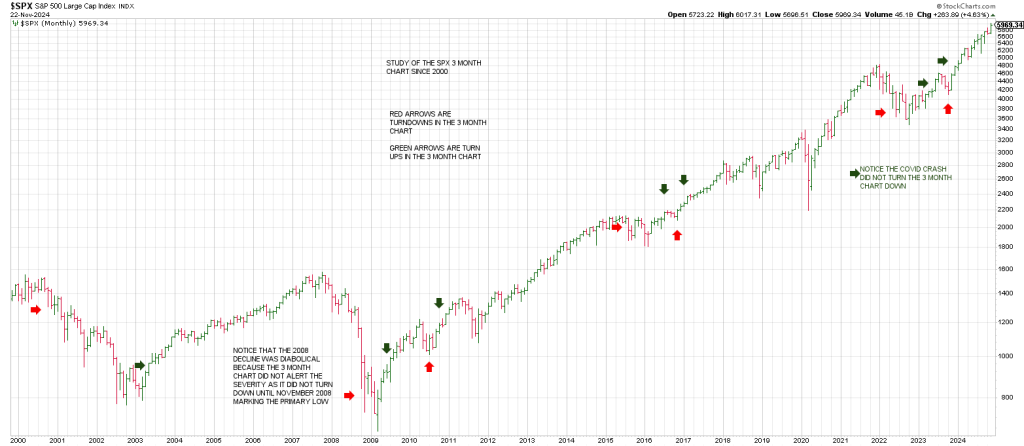
1) The 3 Month Chart turned down in November 2000 shortly after the Secondary High in August 2000, acting as confirmation of that Secondary High.
2)It remained pointing down the entire bear finally turning up in May 2003.
It stayed up the entire advance through 2007.
3)However, the 2008 decline was diabolical inasmuch as the 3 Month Chart did not alert to the severity of the decline as it did turn down until November 2008, defining the Primary Low.
4)The 3 Month Chart turned back up in June 2009 and stayed up all the way until August 2015.
This was the onset of a 6 month A B C correction into February 2016.
5)The 3 Month Chart turned back up in August 2016 and immediate turned back down in November 2016.
The turndown defined a low with the SPX leaving an outside up month turning back up immediately in January 2017. The turndown into the 2016 election followed by the immediate turn back up to the topside underscored a low resulting in a furious 15 month rally into January 2018.
The runaway move never saw the SPX trade below its prior month low throughout that stretch.
The 3 Month Chart remained up from January 2017 through June of 2022 when it finally turned back down marking the Primary low of the 2022 bear market.
6)After the June 2022 Primary low the SPX turned its 3 Month Chart back up in June 2023.
A high came quickly in July 2023 where a sharp decline played out into October where the 3 Month Chart turned back down.
7)The 3 Month Chart turned up immediately after the October 2023 low in January 2024 signaling higher prices.
The 3 Month Chart has remained pointing up since January.
And, in an echo of the 2021 rally, it has not traded below a prior months low for more than one month. And, it has only done so twice, it April and August.
if the big picture trend is still pointing conspicuously lower, then a turn up of the 3 Month Chart is going to define a high. It did.
This same 3 Period Chart applies to the dailies and weeklies on a lesser degree of significance obviously.
The 3 Period Chart is the backbone for the Hit and Run Swing Method and how we determine the trend.
In sum, while sentiment is not a timing indicator, history shows that extremes in public commitment for stocks occurs at the worst possible moment to be a buyer of stocks.
The Wall Street Journal recently reported that U.S. households allocations to stocks as a share of total financial assets has reached an all-time high.
People do a lot of crazy things when they’re in love.
For example it was one thing when market participants plowed into stocks when interest rates were zero and TINA (There Is No Alternative…to stocks) trumped the tape.
But now TIAA on the scene: There Is An Alternative. A risk free 1-month Treasury Bill yields 4.72%.
Once prudent buyers have thrown in the towel because they see no reason for the market to bull market to come to an end, you can be sure that end is near.
Why should market participants see an end to the market: the market has shrugged off everything thrown in its path.
But as my dad use to tell me, the greatest risk is when it looks like there is no risk at all.
Mr. Market has convinced us of three things over the last 24 years
1)that it always comes back.
2)that the market can’t be timed so Buy and Hold is obviously the way to go.
3 The Fed is Zeus
Risk is recognized slowly, then all at once.
In sum, with the prospect for a major cycle in place, there should be synergy with the last major low from 2009.
That price was 667 SPX.
That price resonates off December 7th.
667 is 180 degrees straight across and opposite December 7th.
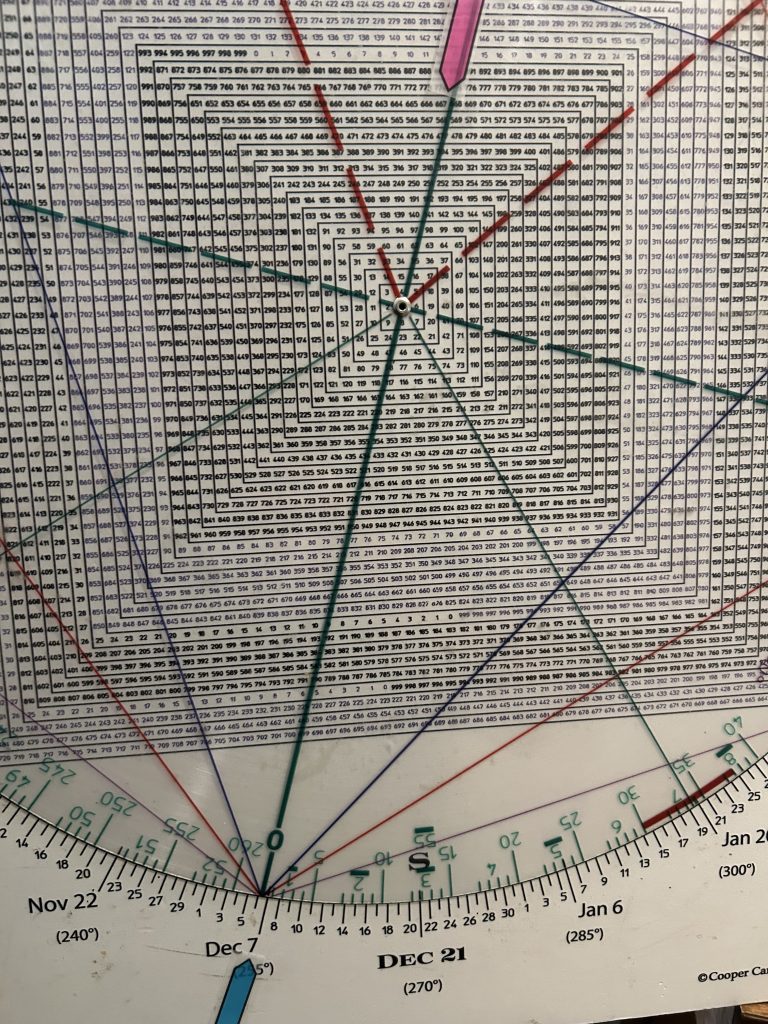
In the same vein, the 40/41 DJIA low after the Great Crash from 1929 is opposite the first week of September, the high in 1929.
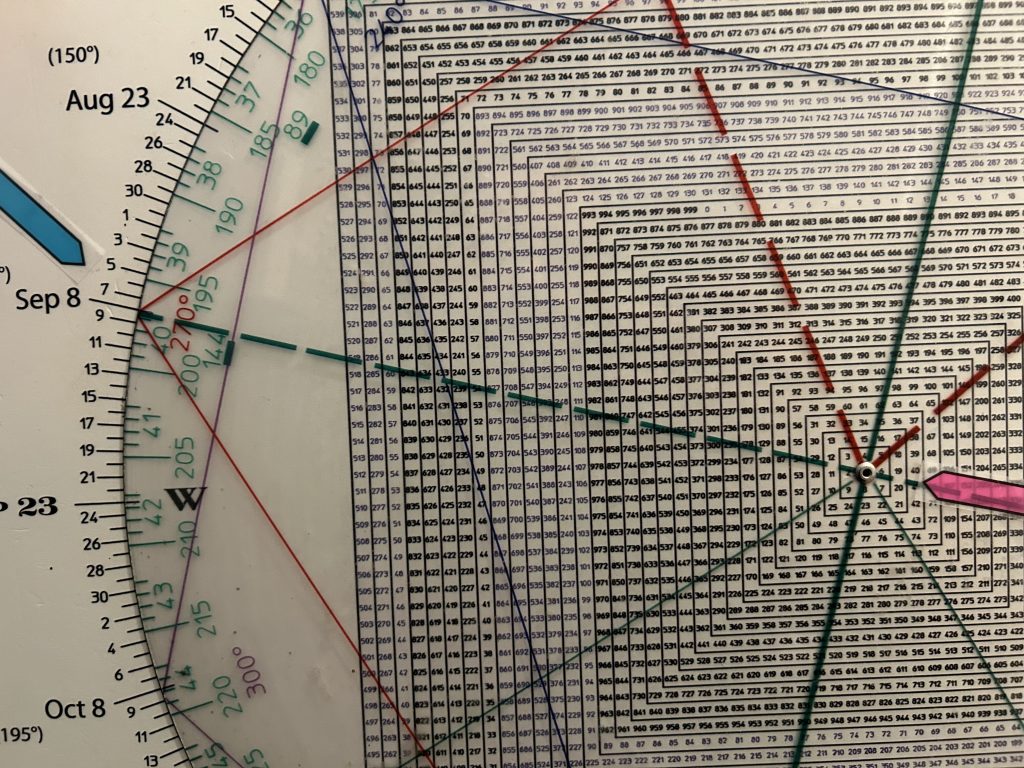
Tomorrow’s report will highlight the historic synergies surrounding this early December period.