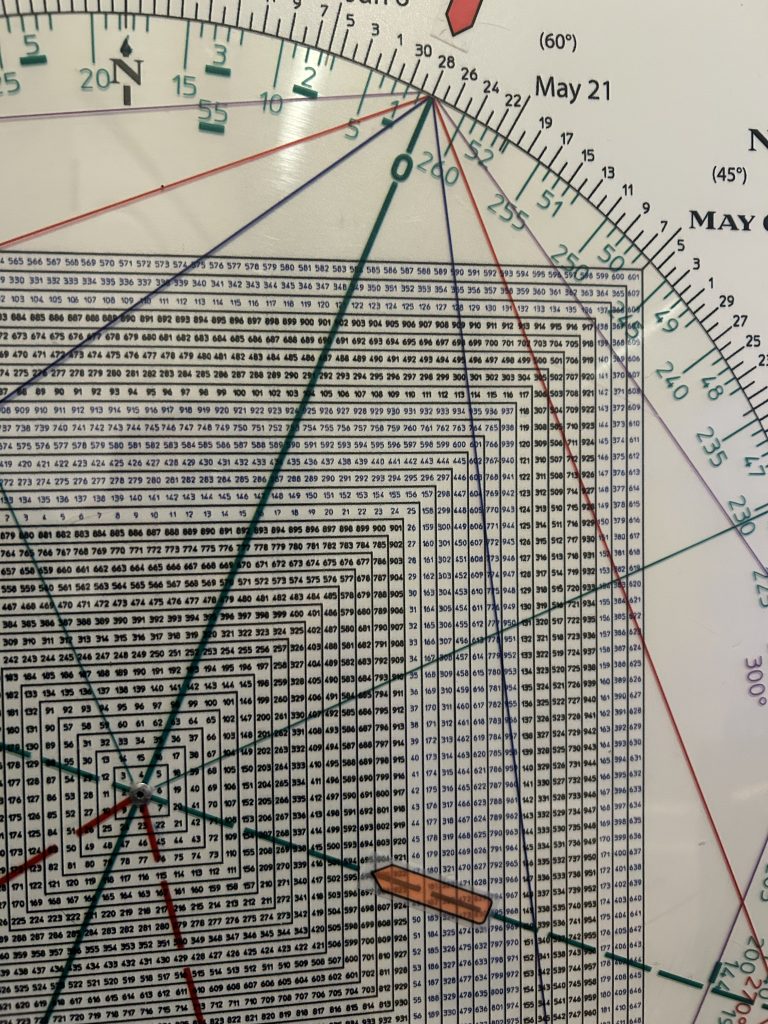
On May 19 the SPX struck a time/price square-out.
The high on May 19 was 5968 (596)
At the time we showed how 596 squares-out with May 19-21st squares-out with 596.
May 19th was an outside up day. The SPX looked set for continuation.
Two days later the index knifed below the low of May 19th triggering a Reversal of a Reversal or what I call a Keyser Soze.
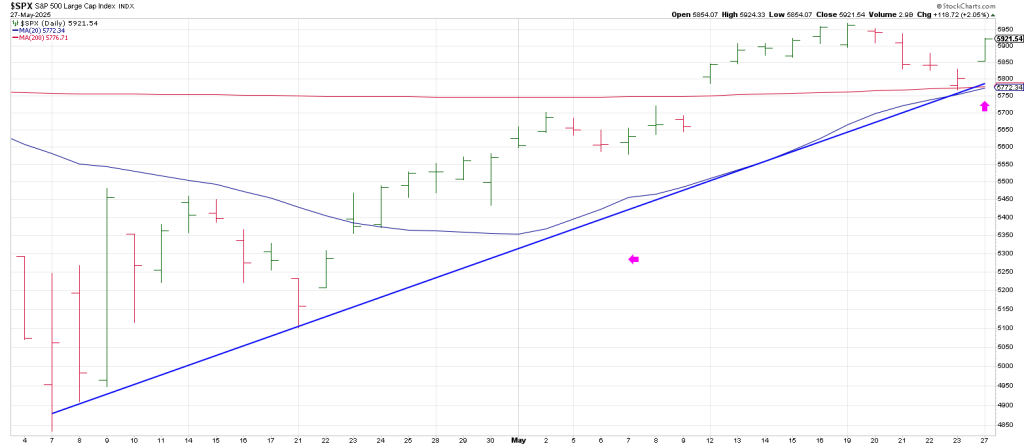
The SPX followed thru to the downside testing its 200 day moving average on Friday into the gap window from May 12th.
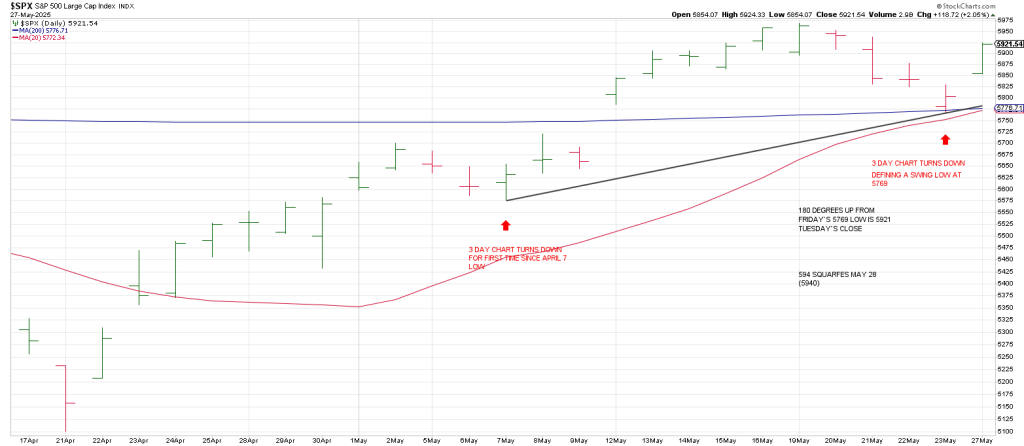
The SPX 3 Day Chart turned down on Friday.
In a strong uptrend a turn down in the 3 Day Chart should define a low soon in terms of time and price.
It was immediate: the SPX bottomed near Friday’s open.
I can’t help but wonder who knew what and when they knew it about the tariff pause.
The first time the 3 Day Chart turned down since the April 7th low was May 7th.
3 days later markets exploded.
Be that as it may from Friday’s low to Tuesday’s high nailed a perfect 180 degree rally:
From 5769 to 5921 is 180 degrees.
90 degrees up from here equates to 5998 which obviously eclipses last Monday’s high for the move.
Yesterday’s powerful broad-based rally saw breadth aligning with price—a rarity of late.
Volume swelled indicating institutional conviction behind the move rather than a mere short-covering bounce.
The question is does the surge mark momentum that will carry the market to new highs or does it mark at least a short-term buying climax?
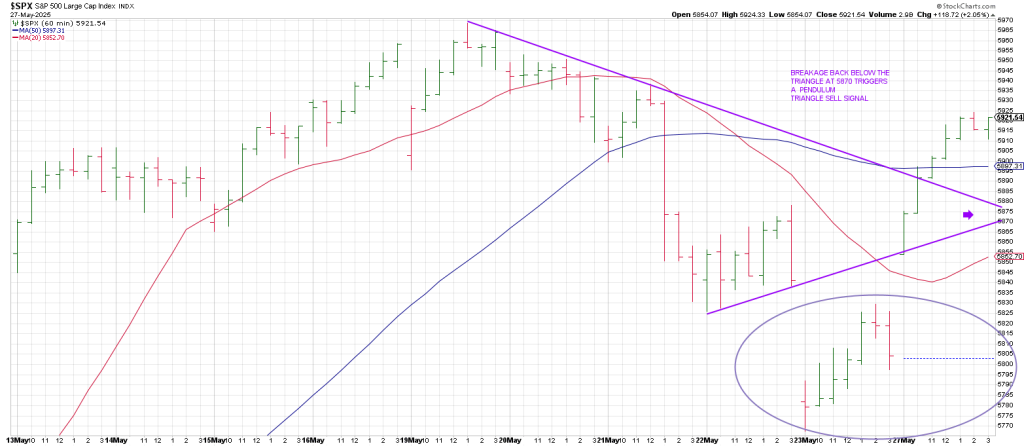
An hourly SPX shows an Island Bottom with yesterday’s gap above the 20 hour reclaiming the 50 hour ma.
Breakage below Tuesday’s gap will trigger a Jump the Creek sell signal in tandem with a failure back below the now rising 20 hour ma.
Both the 20 and 50 hour ma’s have turned back up to the topside so breakage below both over coming hours is a negative.
Two other factors will be key here:
1) Trade above Tuesday’s high puts the SPX in the Minus One/Plus Two sell signal.
This is because the 3 Day Chart is pointing down as of Friday (-1).
Two consecutive higher daily highs satisfies a +2 to complete my swing sell setup.
2) At the same time a push to 5940 satisfies Time/Price square-out.
3) This is because 594 squares-out with May 28.
In sum, the SPX exploded over an hourly triangle on Tuesday.
Breakage back below the bottom of the triangle at 5870 region triggers a Triangle Pendulum sell signal
The SPX has done what was needed to produce a 3 point trend line off the April 7 low.
In coming hours/days this Bottoms Line ties to 5830, Phil D Gap—from Tuesday.