“Divergences are like laxatives. You never know if one is enough or two is too many.” Justin Mamis
Following Wednesday’s record high, the SPX pulled back on Thursday leaving an NR 7 day in the context of a continuing up down up down sequence since the September 26th peak which was the record high prior to Wednesday.
Also continuing is the divergence between the SPX’s price and the McClellan Oscillator which we discussed yesterday.
In Thursday’s session the McClellan Oscillator posted a further decline, deepening its negative reading.
This kind of divergence produces a critical red flag, given that a hallmark of significant tops has nearly always coincided with weak momentum readings—and this new high sets a record in that
Department.
Below are the McClellan Oscillator readings at the precise peaks of historic bull markets:
1929 + 28
1961 -12
1973 -6
1987 +3
2020 -6
Each of these significant peaks showed barely positive or mildly negative momentum readings—
A stark contrast to Wednesday’s -34 reading, marking the weakest reading as compared to every peak day of a Bull Market in the last 95 years.
Interestingly, late November 2021 had a -45 reading, but a nominal new high eked out on January 4th in the SPX.
There’s always a T Rex in the market ointment.
Be that as it may, the November 2021 high was the Primary High with the Secondary High on January 4th.
However late November 2021 was the top for the NDX.
Divergences between the NDX and the SPX can be very insightful.
For example the NDX struck its low on November 21st, 2008 at 1019.
In March 2009 when the SPX spiked to a lower low below the November crash low, NDX made a higher low at 1040.
Currently the NDX struck its all-time high on July 10th marking a 3 month divergence…so far.
I’m sure you notice that yesterday is precisely 90 days/degrees from the July 10th NDX ATH.
The NDX struck a nominal new high yesterday above its September 26th high for the rebound off the August 5th low.
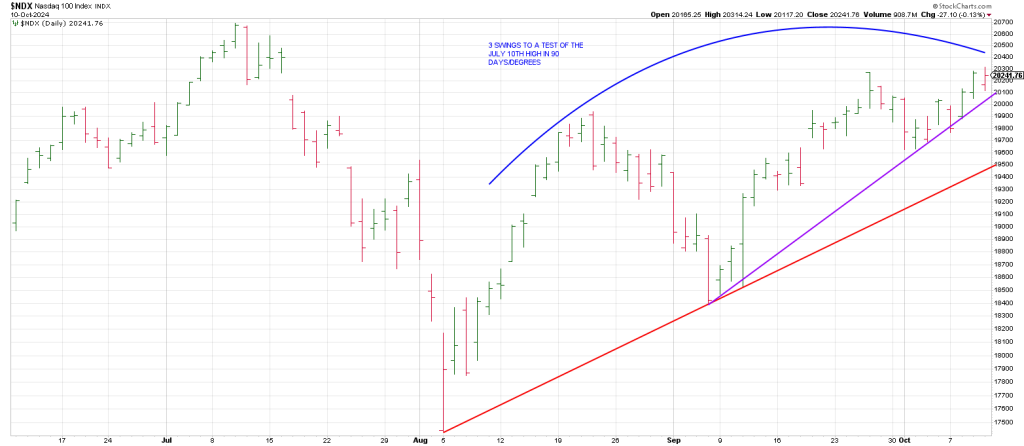
NDX is backing and filling in the region of the first Breakaway Gap on July 17th.
It shows 3 swings to a test of its July high…albeit this weeks high is nominally north of the Sept 26th high.
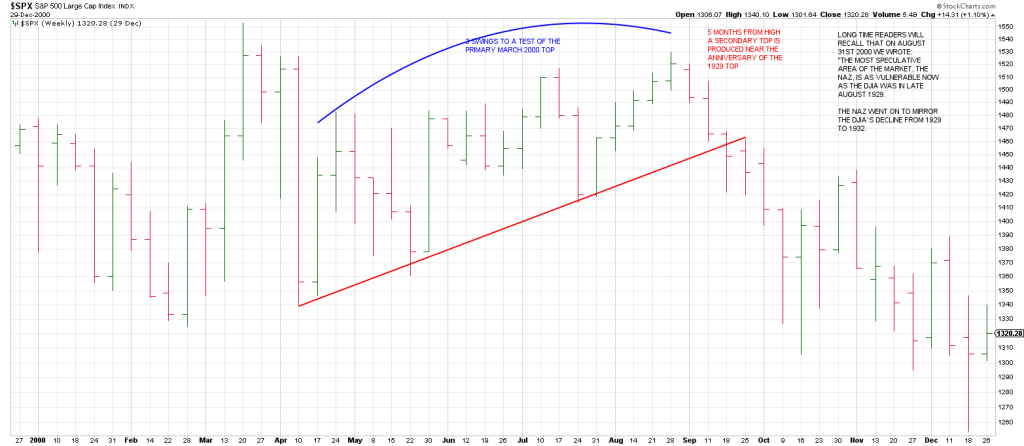
That said, the pattern of 3 Swings to a Test is the same pattern on the weeklies on the SPX on September 1st 2000 that produced the Secondary High to the March 2000 Bubble Top.
In sum, between the historic momentum McClellan divergences and the divergences between the NDX and the SPX and the pattern of 3 Swings to a Test (of all time highs) a red flag is swirling.
Momentum dropped even further on Thursday, underscoring the potential danger ahead and a unique opportunity for those positioned to capitalize on the shift from bull to bear market.
Ignore the loss of momentum at your own peril.
In physics the momentum of an object in an upside trajectory stalls out before the fall.
A ‘stall’ occurs in a plane when an aircraft’s angle of attack exceeds the critical angle of attack, which is the angle at which the wing produces the most lift.
When this happens the wing stops producing ‘lift’ and the airflow separates from the wing’s surface.
The result is a rapid decrease in lift and an increase in ‘drag’, causing the aircraft to descend quickly.