“When the gossip gets to flyin’ and they ain’t lyin’
Wen the sun goes underground.” China Grove, The Doobie Brothers
“If you think of the stock market as a cauldron of minestrone soup that occasionally somebody sticks a ladle in and stirs up, it takes a while before all the vegetables float back to the level that they were at before.” Seth Klarman
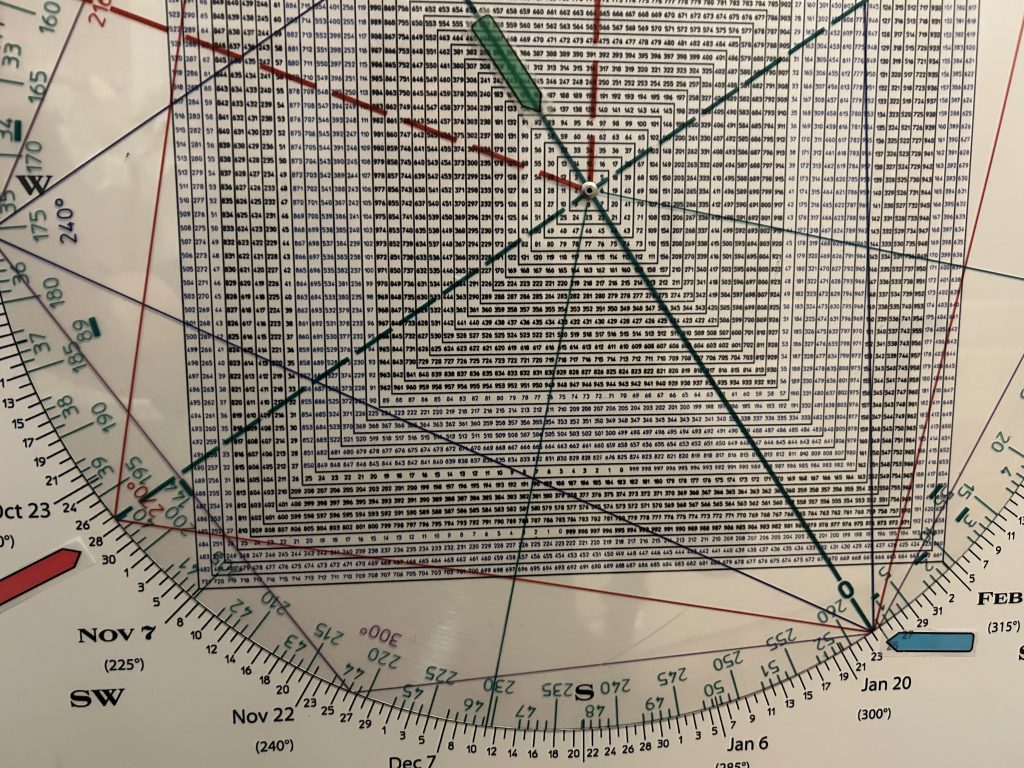
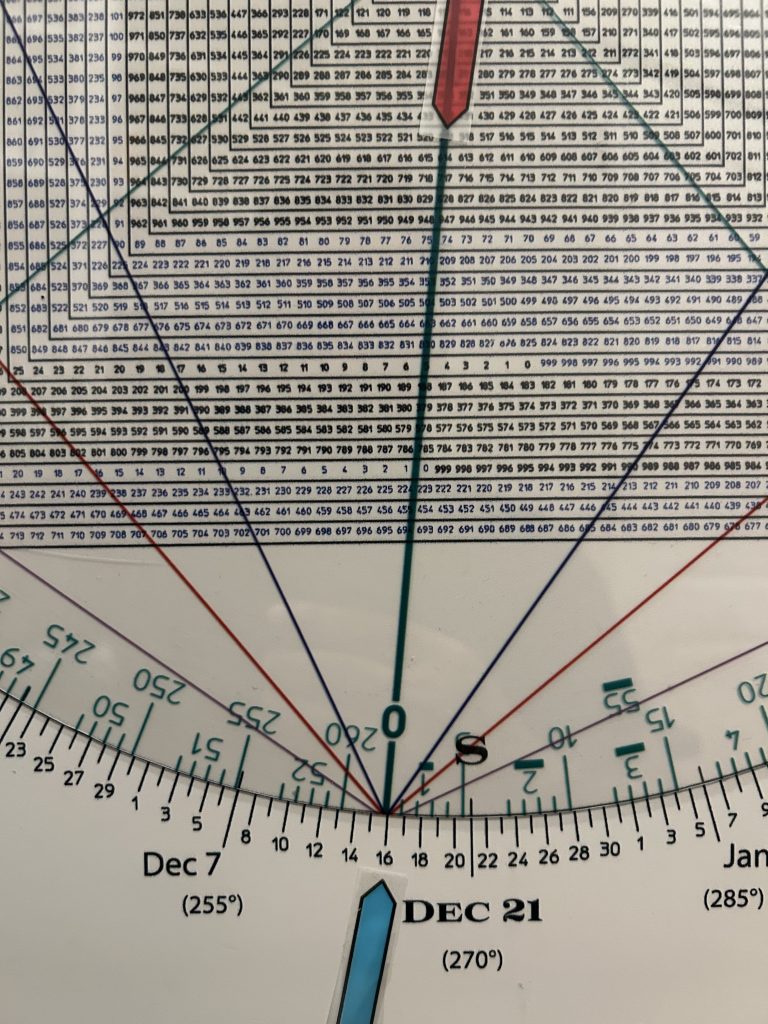
Last fall the Square of 9 Wheel pictured below predicted a major top would occur in January 2025 leading to a waterfall decline.

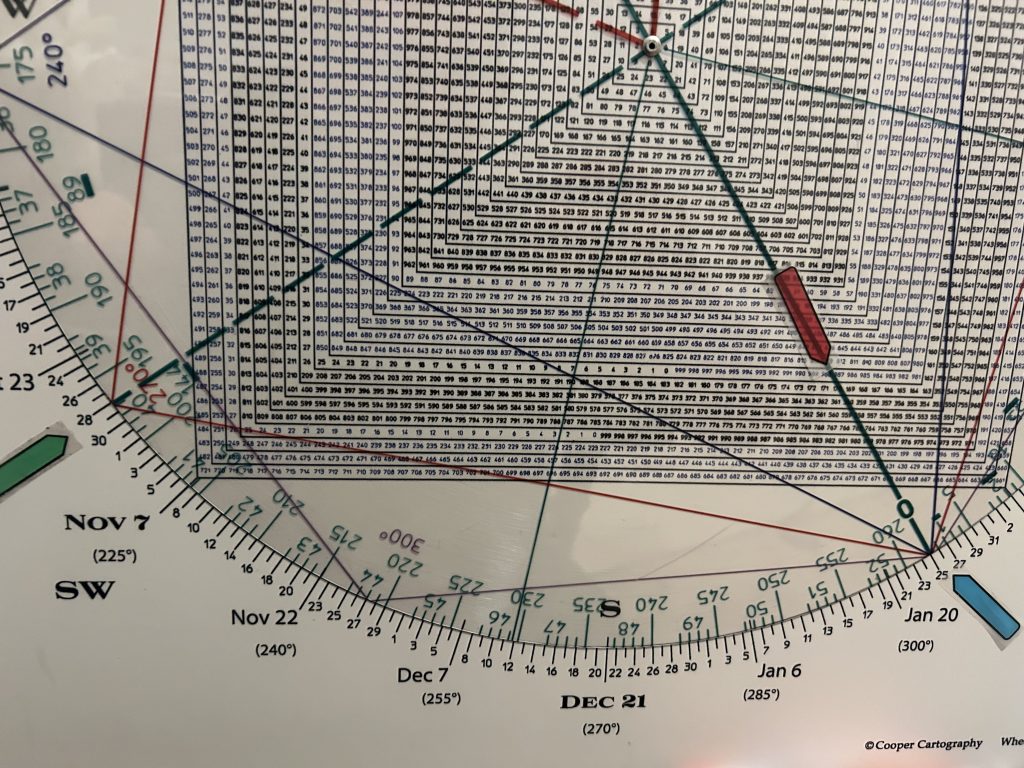
Square of 9 Wheel
Purchase your own Square of 9 Wheel. Shipping to US only. Contact Jeff for shipping outside the US.
The Square of 9 Wheel integrates Time and Price in what the seer W. D. Gann called the Law of Vibration.
You see October 28/29 squares out with January 24th.
Oct 28/29 were the back to back Great Crashes in 1929.
As well 180 degrees straight across and opposite Jan 24 and square Oct 28/29 is 93.
The major low following the October 1929 crash was in July 1932—93 years ago.
That is one factor why a spike into January was likely to see a sharp reversal
When you get a confluence of time and price factors, that are harmonics of major turns in the market there is a strong likelihood they will exert their influence.
Now you may say, Oct 28/29 vibrates off ALL “January 24th/s …which of course is true.
The key is that Oct 28/29 and Jan 24 also forms a T-Square with 93…with 1932 being 93 years ago.
It may sound obtuse, but like with anything the more you study and practice the more you will see.
Repeated practice allows you to observe patterns and identify nuances and develop more proficient understanding and performance.
Let’s look at another example lest you I think I’m curve-fitting.
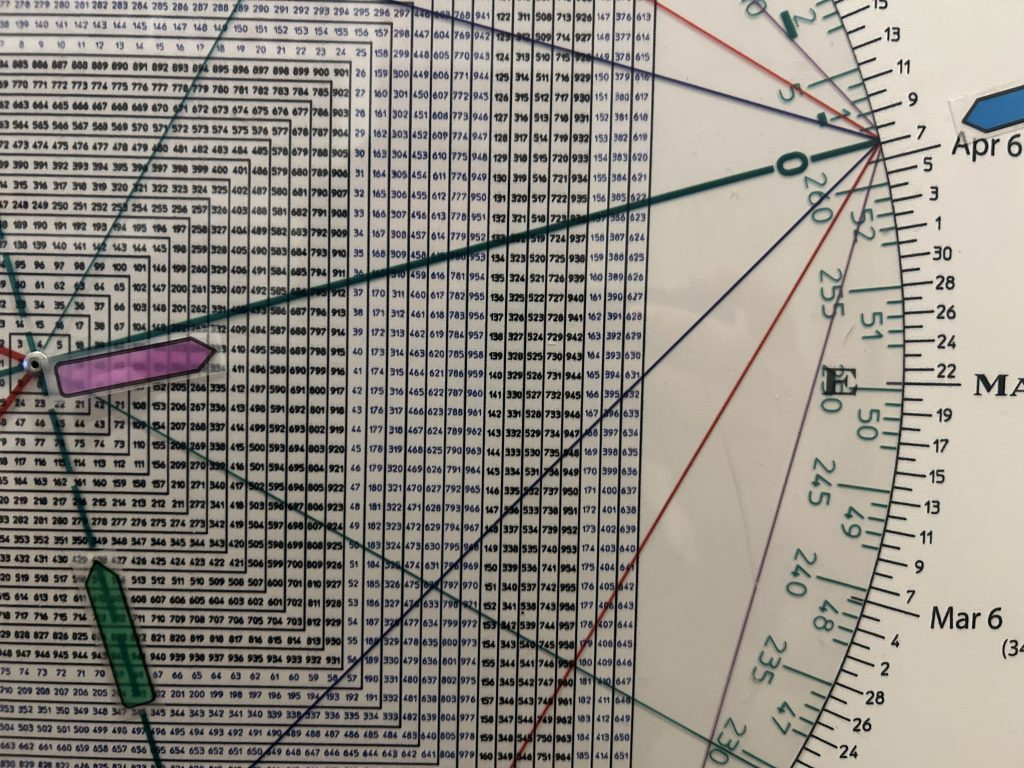
Using the number grid in the middle of the Wheel as “years” instead of price, shows that the year 1987 squares-out with January 24/25 and thereby also squares-out with October 28/29.
Consequently, if you were trading in 1987 and in September recognized that the pattern playing out was an echo of that of 1929’s blow-off and crash, you could have anchored the year 1987 and seen that it vibrates off Oct 28/29…the crashes in 1929.
Additionally, if you anchored the DJIA price high of 386 you would see that it squares-out with October 19th, Black Monday, in 1987.
In other words, the price high in 1929 “points” to the crash day in 1987.
In sum, Price points to Time, and Time points to Price.
While the price high of the SPX in this cycle was on February 19th, the Orthodox high was January 24th.
Moreover, the Momentum High was December 16th.
Allow me to explain, the SPX traced out a high-level consolidation throughout December 2024 but on Monday December 18th nose-dived thru its 50 day line triggering a Rule of 4 sell signal in the process.
This is a break of a 3 point trend line.
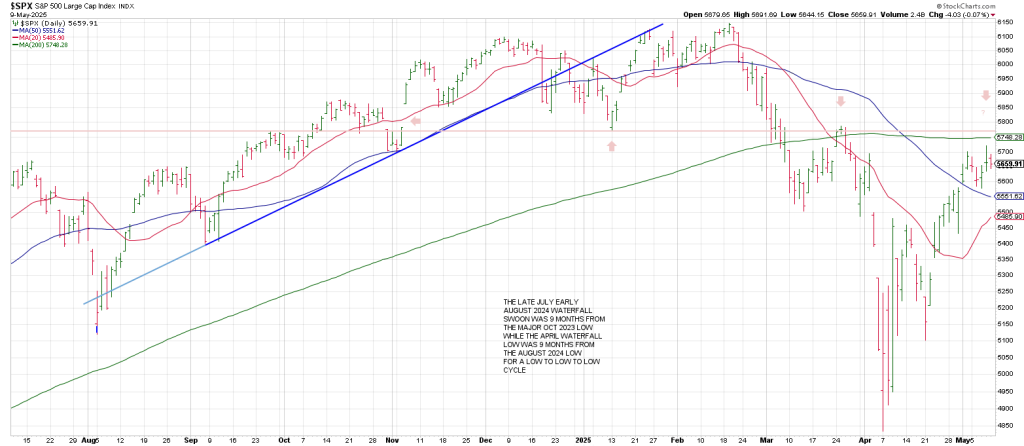
This morning the SPX will open at a backtest of the bottom rail of the Bull Channel from 2022.
Our forecast for 2025 was for a Primary Top in January.
Markets typically trace out Secondary Tops.
We got a double top for a Secondary High, a Test of a Test Failure confirmed by a weekly signal reversal bar on the week of Feb 19th— December high, January test and Feb Test Failure. It was a Pop Quiz that the market flunked in Feb.
Our forecast was for a waterfall decline starting in Q1.
On February 19th, the SPX squared-out with the mid-December Momentum Peak.
Mid-Dec squares out with 614/615 ((6147), the Feb 19th ATH high.
Price vibrated off the time of the end of momentum when many big names such as TSLA and MSFT found high.
A 7 week Gann Panic followed.
Hit and Run members were warned well in advance of the strong decline.
Why was April 7th an important low?
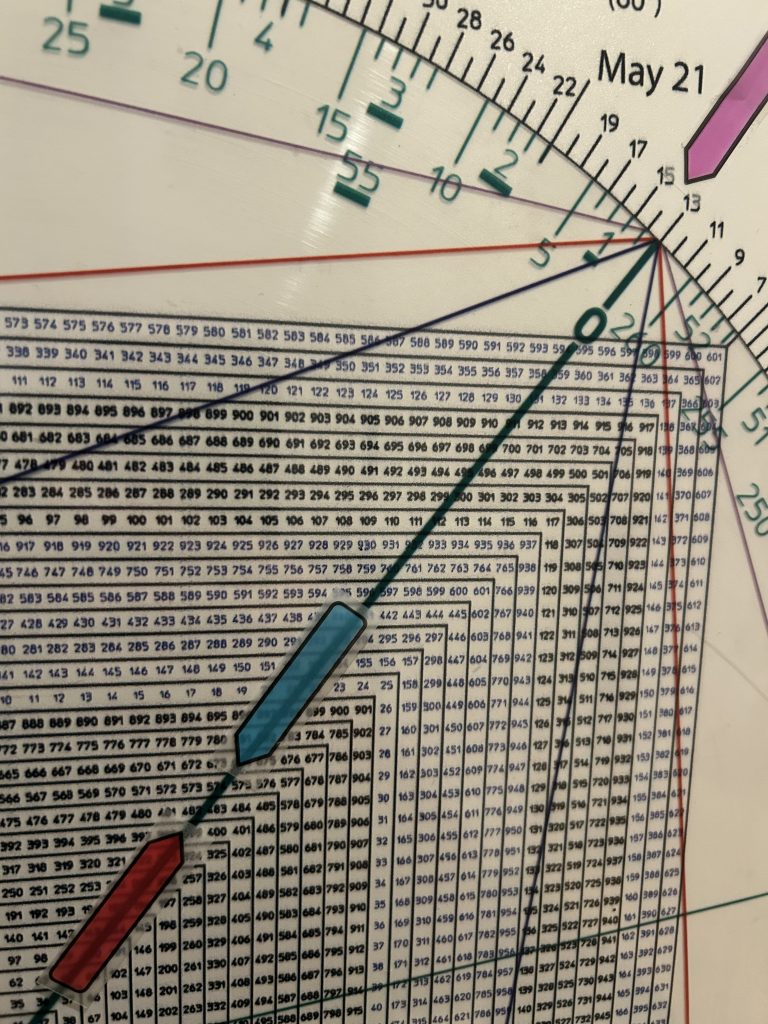
April 7 squares out with 349 (the 3491), the October 13, 2022 bear market low, the biggest low in the last 2 ½ years.
The most important high over the last 3 ½ years is the Jan 2022 peak of 4818 (481/482).
This ties to the April 7th 4835 low (483).
Checking the Square of 9 Wheel shows 482/483 squares-out with May 13th.
Will May 13 mark a major Turnaround Tuesday?
As within, so without is not merely an ancient philosophical concept but the very mechanism by which all things come into being.
As the greatest philosophical book ever written, The Bible, tells us, everything that there is nothing new under the sun, all that will be has already been.
The primary concept that restricts us in markets as in life is the belief in external causation, the idea that something outside of our self determines your reality.
This is not magic. It is Law.
It is the manifestation of mass consciousness.
Such was the symbolism of the Great Pyramid of which the Square of 9 is a 2 dimensional representation.
What is the Square of 9 indicating currently.
Above we flagged May 13 as a possible pivot.
May 12, 13 squares out with 575 (5750) on the Square of 9 Wheel.
The SPX has already reclaimed a 50% retrace of this years decline.
That level is 5491.
Any time an item can reclaim a 50% retrace, the point of equilibrium, following a wash-out, we must consider the idea that at least a test of the highs or a new leg up is on the table.
A pullback must hold the 5491 region.
If a pullback is impulsive (5 waves) the indication is that the 5491 will be breached.
If a pullback is corrective in nature (3 waves…A B C), the indication is that final fling to new all time highs will play out into the summer.
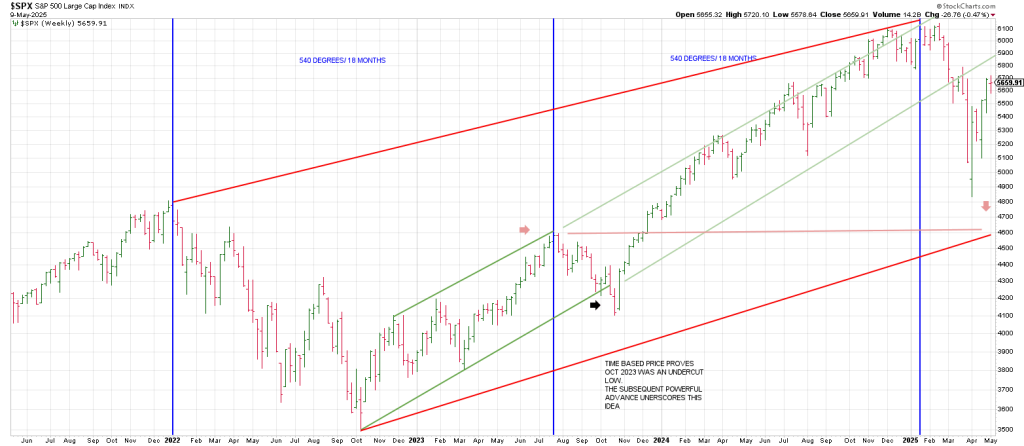
A weekly SPX from the Oct 2022 bear market low shows the bull case.
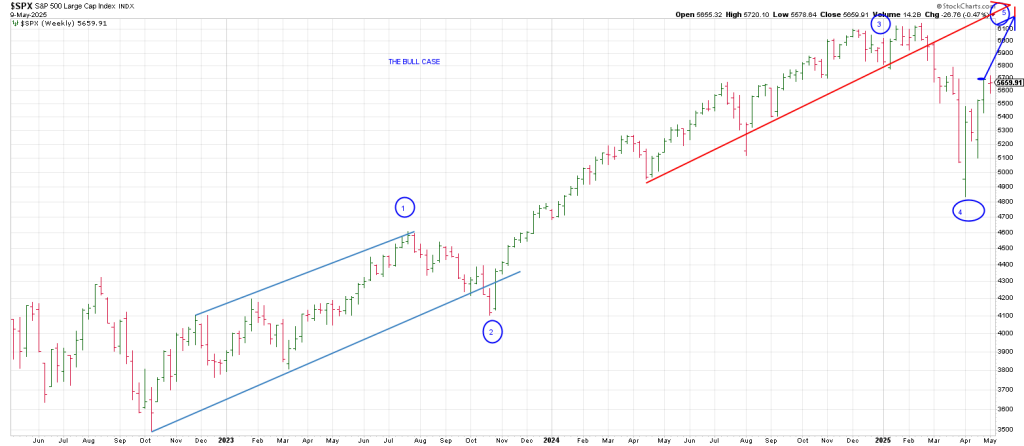
Notably, April 2025 was 540 days/degrees (18 months) from the significant Oct 2022 low where the blow-off started.
18 months is a cube-out in time as a true square (a cube) has 6 sides of 90 degrees = 540 degrees.
Today we’re getting more Headline Roulette. But sometimes the hype does not match reality when a big announcement is dangled.
The White House is calling this a “China Trade Deal”.
It sounds pretty definitive.
But as U.S. Trade Representative Ambassador Greer told the press….”there was a lot of groundwork that went into these two days…and we’re confident that the deal we struck with our Chinese partners will help us to work toward resolving that national emergency.”
“ deal”/ “work toward”?
A 90 day deal. Whatever it takes to save Christmas.
I’m sure an agreement will cover areas such as intellectual property theft and currency manipulation and of course tariff rates…what will they be going forward. And then there’s fentanyl.
The devil is in the details.
Naturally, the machines are buying. But they are always Ready, Fire, Aim.
More important may be India and Pakistan.
Since last year we outlined the War Cycles due to exert their influence starting in 2023 to get progressively more powerful
Are the 4.1 and 5.7 magnitude earthquakes in Pakistan in recent days (not on tectonic fault lines) and indication India cracked open nuclear bunkers?
The silence may dwarf the headlines.
The Hit and Run newsletter has been providing market timing along with long/short swing trades and day trades since 1996.
Since 2017 we have added the Private Twitter/X Feed which offers a blow by blow of the market action in real time, actionable trading ideas, and the ability to ask questions in real time.
A new feature this year has been our daily Roadmap offering likely turning points for the day.
The expectation matches the Time/Price Square-out mentioned above for a peak on Tuesday.
A sudden sharp sell-off is a strong possibility, potentially a Flash Crash.
The SPX 3 Week Chart turned up last week. If the market is bearish, history shows. should find a high within a few days of this.
The level where the 3 Week Chart turned up is 5700.70.
Consequently a reversal below that opens the door for the aforesaid down-draft.
Last Monday we stated that Wednesday would either be a pivot low or a high.
It was a pivot low defined by the first turndown in the 3 Day Chart since the April 7th low.
That Pivot Point is perpetuating a surge over the SPX 200 day moving average.
On March 24/25 the SPX Pinocchoi’d its 200 dma.
If today’s push over the 200 day holds, the 2nd mouse is getting the cheese for the bull.