“What the hell am I doin’ here”, Creep, Radiohead
The SPX crept sideways last week.
The index struck a record high of 6099.97 a week ago Friday and dropped to close at the 6050 strike for OpEx.
We have an N/R 7 Week, the narrowest range in 7 weeks. These contractions typically see an expansion in volatility in the next week or two.
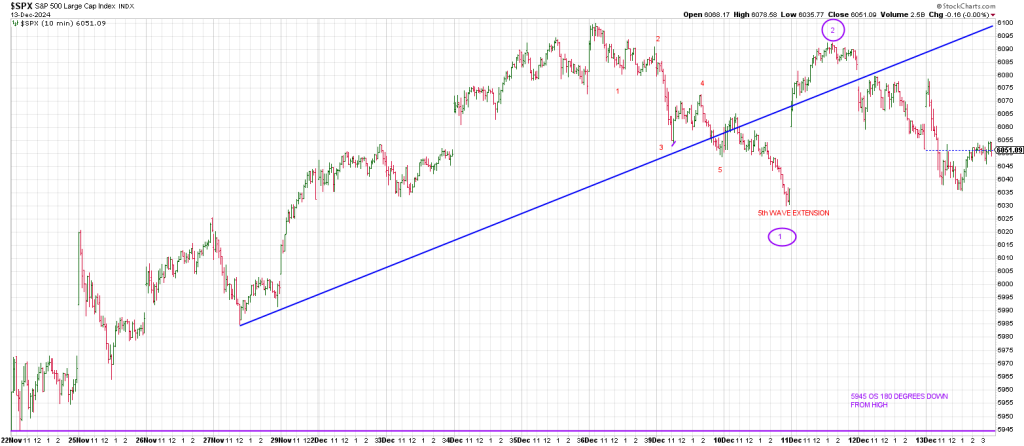
Pulling back the lens to check the hourlies shows a minor 5 wave impulsive decline starting from our December 7th turning point.
Here’s the hourly SPX from Monday’s report showing 5 waves down to Phil D Gap and lateral support.
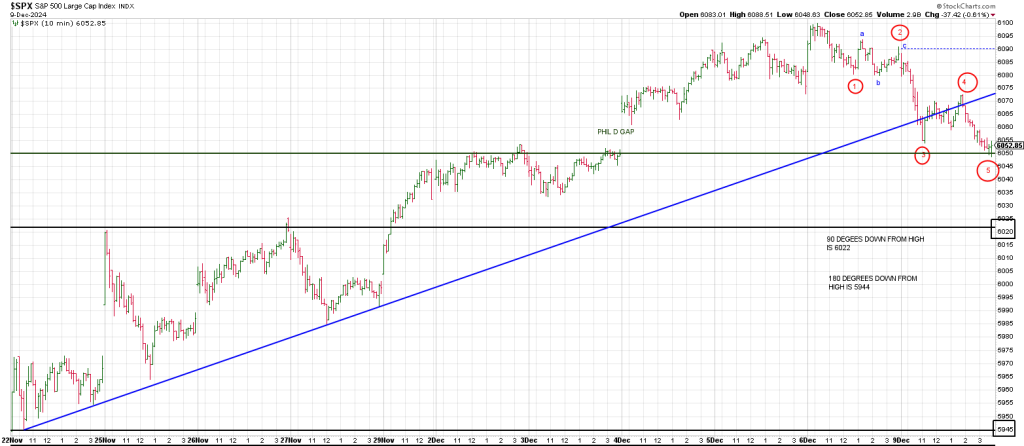
An updated hourly SPX through Friday’s close shows the index satisfied a roughly 90 degree decline (6022) before rebounding on Wednesday.
It was a one day rally that turned the dailies up and rolled over. A potential change in character to the stampede from November 19th…and on the weekly basis from August 5th.
The SPX advanced nearly 1000 points in 4 months from a low of 5119.
Using the Principle of Squares, the SPX has rallied 1260 degrees from the August 5th low.
That’s 3 revs of 360 degrees (1080 degrees) plus 180 degrees.
1260 degrees, the Biblical Time, Times + half Time (360 +720 +180).
We will see if this blow-off in Price adheres to this Biblical TIME period. Is this a Biblical PRICE period?
At the very least this ‘natural’ 1000 point advance coupled with this 1260 degree price run should perpetuate a reaction.
In addition to the impulsive decline in the SPX, there is reason to believe a reaction is on deck in the SPX and QQQ
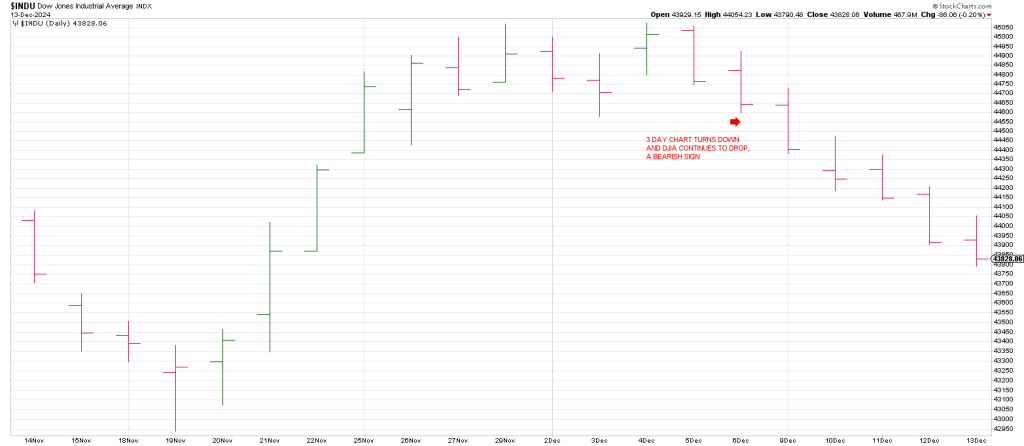
The DJIA has declined 7 consecutive sessions, its longest losing streak since Feb 28, 2020.
As well for the 10th day in a row, the SPX has seen negative breadth. That hasn’t happened since Oct 12, 2000.
As for the QQQ, from its August 5 low of 423, 360 degrees up is 509. Another 90 degrees decrement higher equals 531.
The Q’s struck a record high of 533 last week and closed at 530.50.
The takeaway is that a pullback to 509 should define short-term support. This ties to the rising 20 week moving average.
Alternatively should the Q’s march directly higher, a cube-out of 540 degrees up from the August low is 553/554.
Remarkably the numbers on the 423/509 and 553 axis point to August 5th.
Consequently if the Q’s push to 553 an important Time/Price square-out will be on the table.
Markets move in cycles. We are 5 years from the top and crash in 2020.
This 5 year period marks several important turning points in the market.
For example as we’ve shown before in this space the “real” Roaring Twenties Bull was 5 years from 1924 to 1929.
There was a 5 year rally from 1932 to 1937 followed by a crash.
There was a 5 year rally from 1982 to 1987 followed by a crash.
The advance into the 2000 top started in 1995. Then a crash.
There was a 5 year rally from 2002 to 2007 followed by a debacle.
As we satisfy this 5 year periodicity, it is worth noting that there has been about 1% of time in the existence of the NYSE when equities have been this overvalued.
The market is 40% more overvalued on a price to sales ratio than it was in 2000.
The market is currently more concentrated than in 1929. It is more concentrated than it has been in at least 150 years.
In other words, the top 10 stocks in the SPX account for an outsized share of the index’s market cap and its stunning 2024 performance.
Overvaluation and overconcentration, a Risk Oreo surrounding a creamy euphoric center.
“There is a substantial reason to believe that the Trump Administration will remain fairly aggressive to the pursuit of antitrust prosecutions and blocking mergers in the tech sector and beyond.” Noah Phillips, former Commissioner of the FTC.
The heart of the matter is that at some point the crème de la crème mega-caps succumb to being bitter sweet: a virtuous circle of overweighting in the darlings produces an equal and opposite reversion to the mean when the “weight-loss” starts.
Markets move in cycles, with bull markets inevitably ending in downturns if not crashes.
The current bull market broke records for the longest-lasting and best-performing since WW2 way back in November 2019.
The record was greeted by a Crash in early 2020.
When the record from 2019 was eclipsed, the door was open to a new era of records being broken.
But the first quarter of 2025 marks 5 years from the Covid Crash low, virtually on the anniversary of the 2000 top.
In other words the first quarter of 2025 is the 25th anniversary of the 2000 Bubble Top and the 5 year anniversary of the top and crash in 2020.
Are these just random time frames?
50 years is a fractal of the 5 year cycle.
It was 50 years from the major summer low in 1932 to the major summer low in 1982.
December 2024 is 50 years from the December 1974 Bear Market low.
Is there reason to believe we are on the verge of a momentous turning point?
Leading up to the 1929 crash, euphoria among investors pushed stock prices to unsustainable levels. They thought the economic boom would never end. The brashest speculators went out on a limb to buy on margin. Interest rates made borrowing cheap, encouraging speculation.
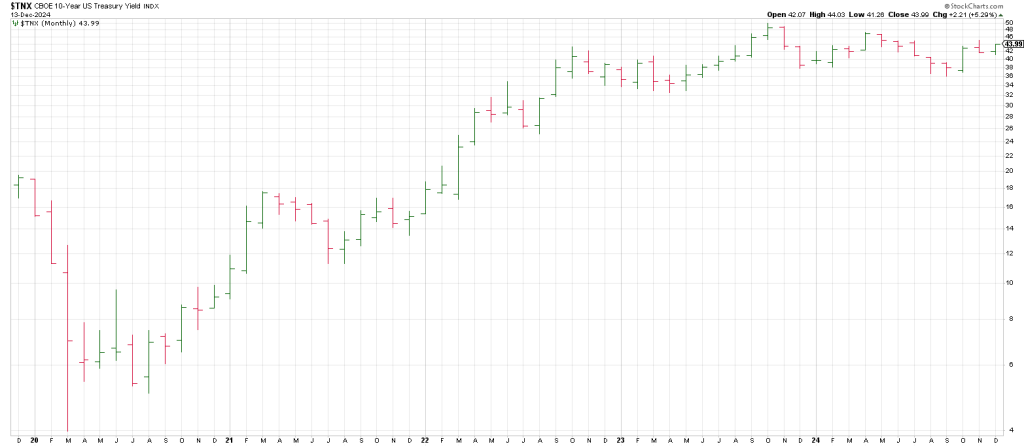
Interest rates aren’t as cheap in the last two years as they were in the preceding 12.
Since January 2021, 10 year yields have ramped from under 1% to 4.40%
What is the market doing here?
The relationship between interest rates and the stock market is in the crosshairs: this is a Fed week.
Concerned about speculation in the stock market, the Fed started tightening its monetary polices in 1928.
The Fed apparently thought this would temper the speculation while not doing too much harm to the markets overall.
Well things happen slowly then all at once.
The tightening of rates may well have built up to a crescendo contributing to the Great Crash.
Then the Fed kept money tight after the crash not wanting to fuel another bubble.
I have been suggesting since last spring that the market is a mirror image fold-back of 1929.
In 1929 the Fed pursued a policy of denying credit to banks that extended loans to stock speculators. Stock market speculation, the Fed had concluded, diverted money from productive uses that benefited American industry and commerce.
Today is a mirror image: the stock market is akin to national security.
It is the heart and soul of the economy, a driver of wealth as a perception of economic health.
The difference today with 95 years ago is computer-driven program trading that caused waves of selling in 1987 as well as later Flash Crashes has increased in speed and prevalence at a time when having learned the lesson from 1929 about tightening monetary policy in an attempt to deflate an asset bubble has created a wild-west atmosphere: the Algomatics seem to be taunting the Fed.
In sum, the Fed is boxed in by the lessons from 1929 and sticky inflation.
To raise or not to raise in an increasingly interconnected world economy where a spark that ignites a market plunge could be lit anywhere.
Like the Carry Trade Flash Crash in early August 2024.
As is always the case at market extremes, the relationship between intelligence and wisdom is skewed.
The old fools watch while the little fools dance.
It will be interesting to see what the market does if it creeps into January 1st, 2025.
On the first trading day of 2008, the plug was pulled and the selling didn’t stop for a year.
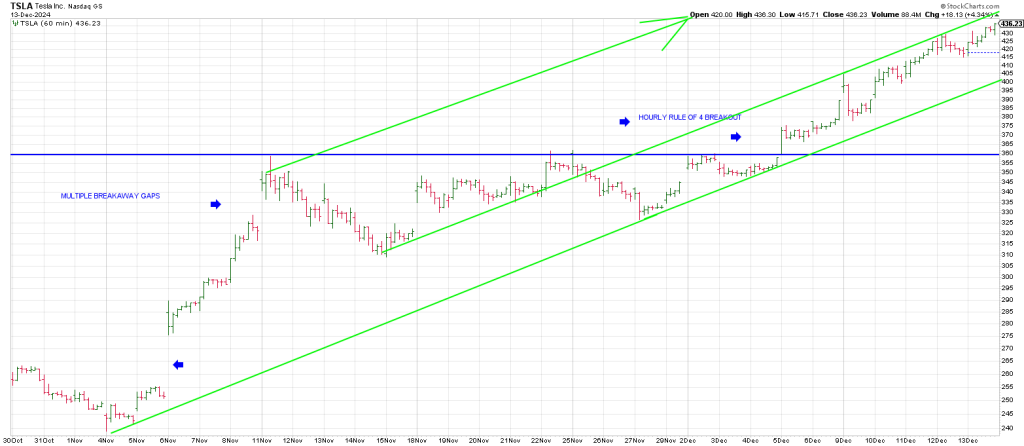
Speaking of year end, Thursday’s Hit and Run showed the following 3 charts of TSLA.
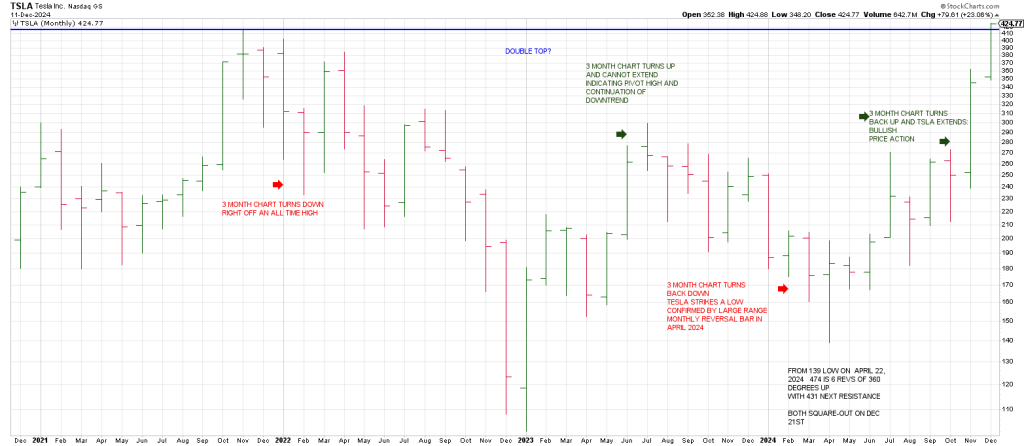
With TSLA trading at 424 on Wednesday, we projected a run to 474 on breakage above 431.
TSLA exploded another 18 points on Friday closing at 436 on the Friday weekly closing basis opening the door for continuation to 474.
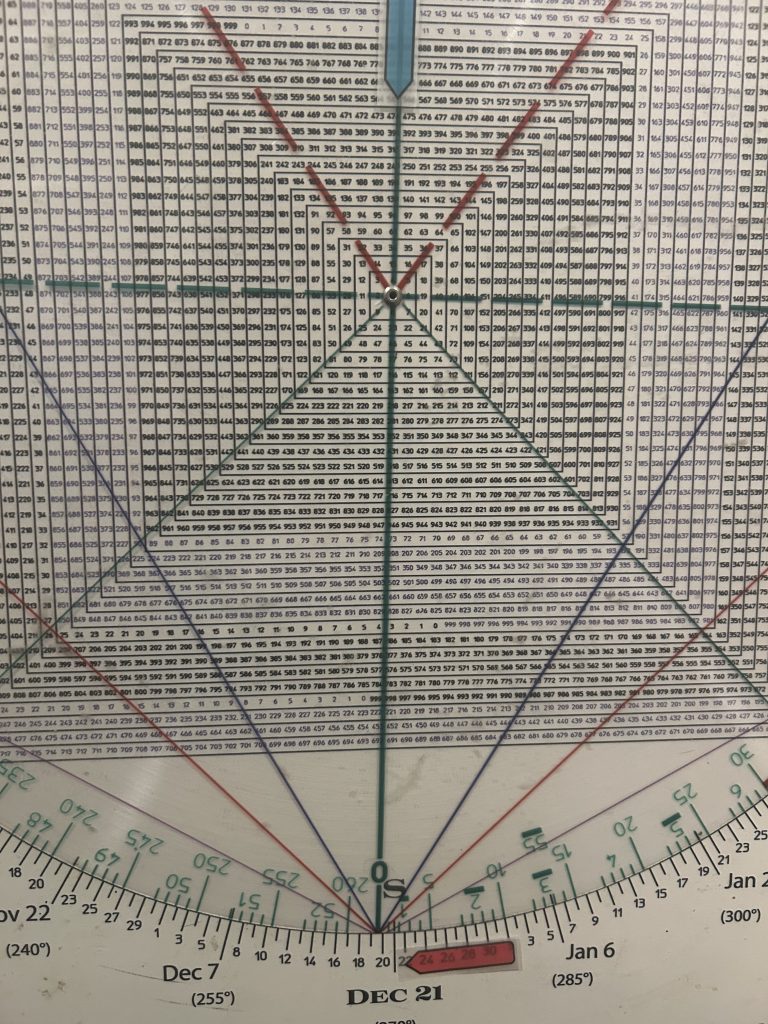
474 squares out with December 21st
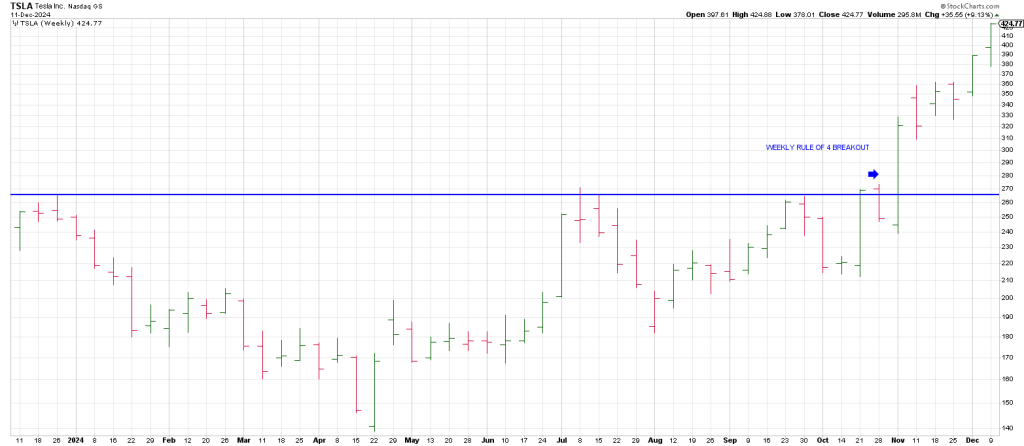
The projection is backstopped by the weekly Rule of 4 Breakout, a breakout over triple tops.
The daily TSLA we showed depicts the bullish daily breakout fractal of the weeklies.
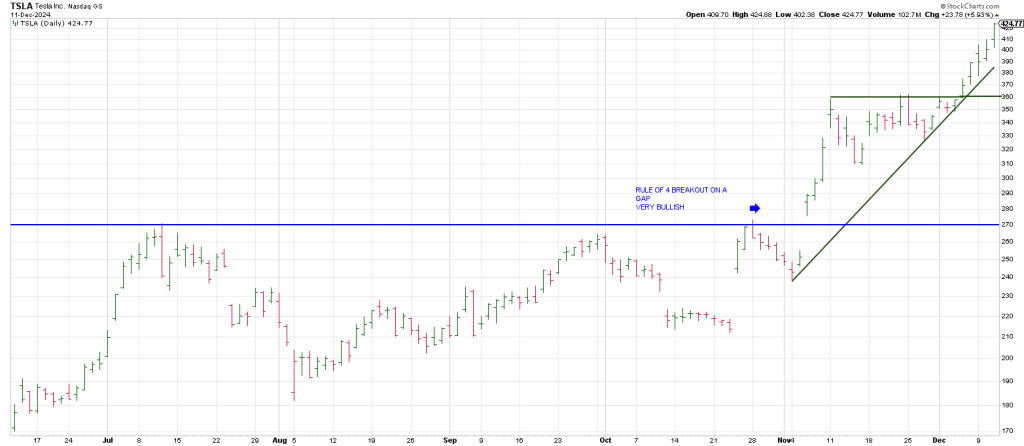
An hourly TSLA shows above a trend channel at 440 opens the door to 474.
Leaders going into the end of a strong year are the tip of the speak of performance chasing.
TSLA is in the straight-away while NVDA is in a U Turn.
AVGO just lapped NVDA.
Would anyone subscribe to a stock trading service for advice on catching moves like TSLA?
Yes. Particularly if beyond making trades, the service educates and empowers you with a key eye for capturing explosive moves before they happen

Square of 9 Wheel
Purchase your own Square of 9 Wheel. Shipping to US only. Contact Jeff for shipping outside the US.