Iran launched a barrage of missiles on Israel and here in America, longshoremen walked of their jobs in what could be a prolonged strike, halting the offloading of vessels across the Eastern Seaboard.
With these developments, markets were already under pressure ahead of Tuesday’s opening bell.
Compounding the situation, all McClellan momentum measures have shifted into accelerating declines.
The DJIA dropped 173 points, while the SPX closed off 53.
The NAZ saw a sharper decline losing 278 points and the small-cap IWM dropped by over 1.5%.
But yesterday’s standout was the VIX, with the VIX derivative UVXY surging 11.51%.
My roadmap suggests similar action today.
SMH, the semi-conductor was particularly hard-hit.
It is hovering just above a 20/50 Bowtie.
Breakage below opens the door to another test of its 200 day moving average at 223/224
This would be the third such test of the 200 day since August.
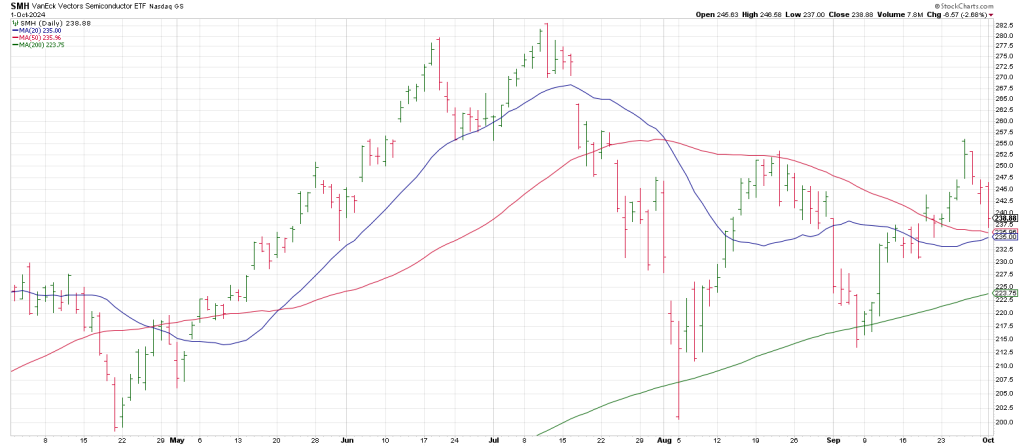
Prior to this summer the last time the leading SMH testing its 200 day was in late October 2023.
There was just one test of the 200 day which perpetuated the surge into July 10th 2024.
From a low of 136.10 in late October, SMH ran up to 283.07 on 7/11.
Notice how SMH put in a nominal new high in July with the Primary High being on June 20th at 279.
This was a perfected square-out because it represents an advance of 900 degrees.
In other words 720 degrees or 2 price cycles up from 136 is 312.
Another 180 degrees around is 278, the July high was 279.

On June 20 at the Summer Solstice, a natural turning point, SMH left a Key Reversal Day and a Gilligan sell signal. It gaped up to a new 60 day high and closed near session lows.
The Secondary High on July 12 produced a second Key Reversal Day.
The second mouse got the chips.
It perpetuated a fast move to 200 on a gap open below the 200 day.
It was the opposite of the top…it produced a Gilligan buy signal.
August 5th saw a gap open to a new 60 day low with a close near session highs.
A few days ago we wrote about the October 11 anniversary date.
October 11 is 90 degrees/days from the July 11th all-time SMH high.
October 11 is opposite 201 which ties to the August 5th crash low.
In sum, it looks like once again the time-frame around October 11 is going to be pivotal.
We have a potential secondary low on SMH, on September 6th.
However at the same time, the picture may be a Wave 1 down from June/July to early August,
Followed by an A B C countertrend rally for a Wave 2
If that count is correct, SMH is on the verge of a dramatic Wave 3 decline through the 200 day moving average….in the heart of October.
That would open the door to the 160 region, the high in July 2023 and November 2021.
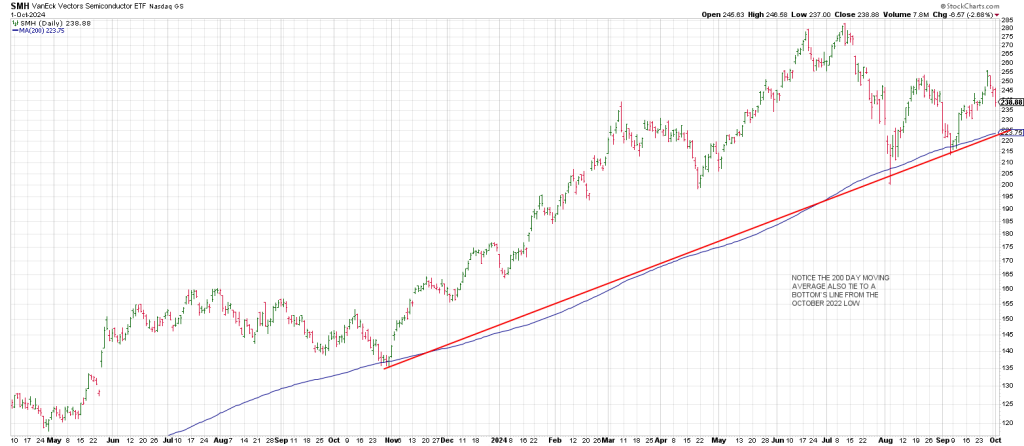
As the above chart shows the 200 day moving average ties perfectly to a Bottoms Line connecting the October 2023 low with the August 2024 low.
That looks like the door that points to the path of perdition.
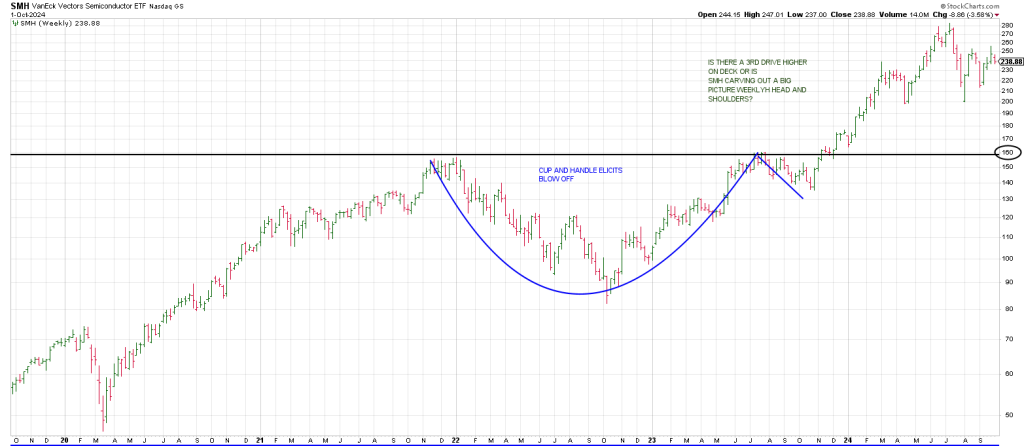
Zooming out to the weeklies, a big picture Cup and Handle elicited a blow-off starting in October 2023.
Either there is a 3rd drive higher for a ‘fleur de lis’ finale or SMH has carved out a Head and Shoulders Top.
The time frame around October 11th and the action around the 200 day moving average will telegraph the tale of the tape.