“Buy Buy says the sign in the shop window
Why? Why? Says the junk in the yard.” Junk, Paul McCartney
Most of what we understand about how a narrow leadership group forms a final market top comes from an historical study of the early 1970’s and the 1973-1974 Bear Market that followed.
The theme is simple: every action is eventually met with an equal and opposite reaction.
A Reckoning.
Below is a chart array covering January 1, 2024 through September 20, 2025, with the Mag Seven shown in the top pane.
As the Mag7 advanced, their outsized weight in the SPX and NDX carried both indices to new highs, even as panes 5 through 8 revealed persistent deterioration in market internals.
Pane 1 is the weekly Mag7
Pane 2 is the weekly DJIA
Pane 3 is the weekly SPX
Pane 4 is the QQQ
Pane 5 is NYHIGHS
Pane 6 is NYHL
Pane 7 is the SPX % of stocks above their 20 dma
Pane 8 is the NYSI (NY Summation Index)
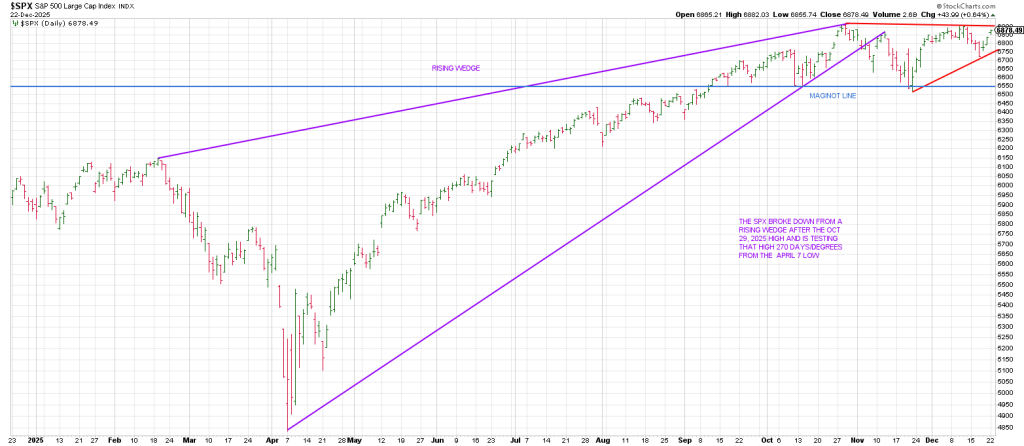
The following array focuses exclusively on the final quarter of 2025 and delivers a powerful message ab out the trend ahead. The elephant in the room is clear: for the first time this decade, the Mag Seven—using the MAGS ETF as a proxy—have entered a downtrend.
Since October 27, 2025, the date of the Fed rate cut, preceding this month’s rate cut, the Mag7 have been declining alongside already declining market internals.
While the DJIA managed to eek out a marginally higher high into December 11, it did so with all market internals continuing to deteriorate and with the Mag7 already trending lower.
Since December 11—again, coinciding with the most recent Fed rate cut—the DJIA has joined the SPX and NDX, along with all major internals, in a downtrend.
In sum, in markets external follows internal like night follows day.
Regrettably, The Market Cycle is not always as conspicuous as night following day.
But there is a Day of Reckoning.
From our perspective, the final bullish support underpinning the trends of the SPX and NDX—and now even the DJIA—has been removed.
Just as the aftermath of the Nifty Fifty in the early 1970’s marked a prolonged and unforgiving adjustment, history reminds us that ONCE LEADERSHIP FRACTURES AND INTERNALS DETERIORATE, MARKETS RARELY RESOLVE SIDEWAYS.
The chart that follows shows the Bear Market that unfolded at a similar point in the cycle in 1975—not as a prediction set in stone, but as a reference for how such transitions have historically progressed as in:
1981
1987
2000-2002
2007-2009
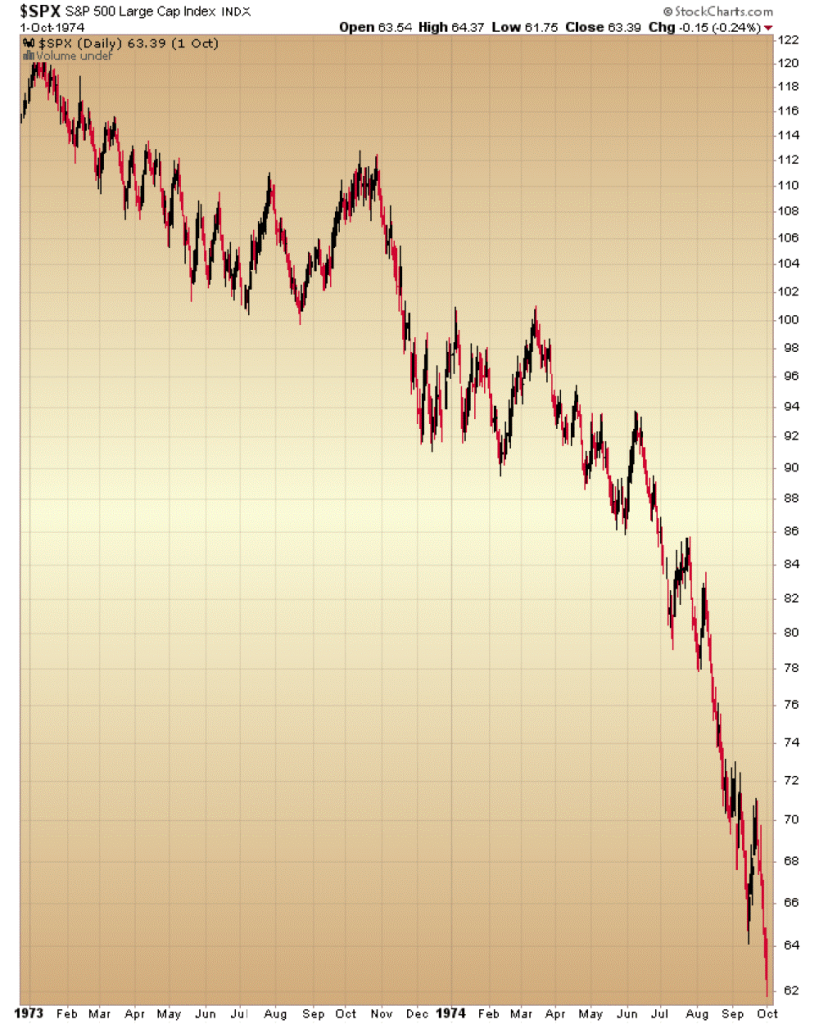
With former leaders now declining, breadth fully broken, and all major indices aligned to the downside, the evidence argues that this cycle has entered its next phase.
In markets, excess is eventually corrected— and leadership reversals nearly always mark the point where that correction accelerates.
I say “nearly always” because the market can do anything. Our job as traders is to identify the odds.
Yet…on CNBC yesterday I saw one market pundit pound the table about how the recent strength in the indices despite the erosion in the Mag7 is a sign of strength…that the SPX is shrugging off the distribution/downtrend in the Mag7 (X TSLA).
Apparently he never heard the expression; “dance with the one that brung ya”.
For good reason…he’s a money manager. He’s talking his book.
Gann’s Master 60 Year Cycle is due to exert its influence as the bell rings on 2026:
A secular bull market top occurred in January 1966.
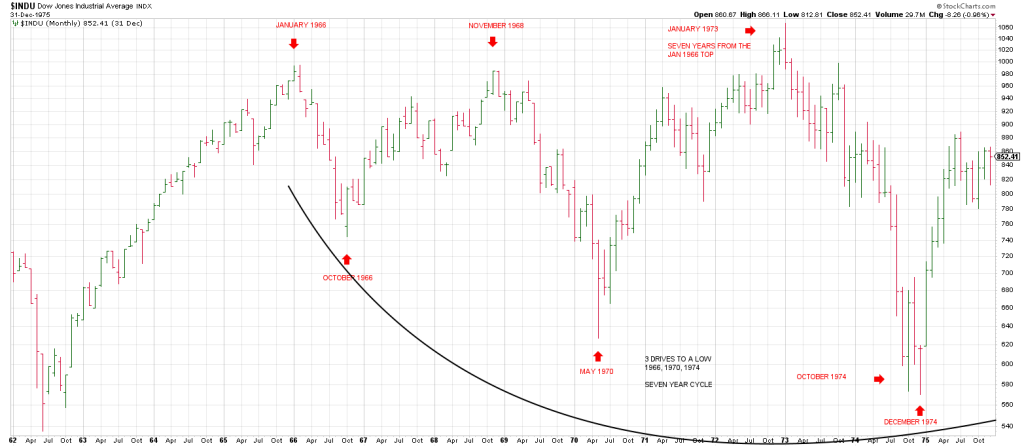
Notably that Secular Bull Market started from a June 1949 low.
As offered, it ended in January 1966—a period of 16 years 7 months or 199 months.
The Current Secular Bull Market started from a low in March 2009.
16 years and 7 months later gives October 2025.
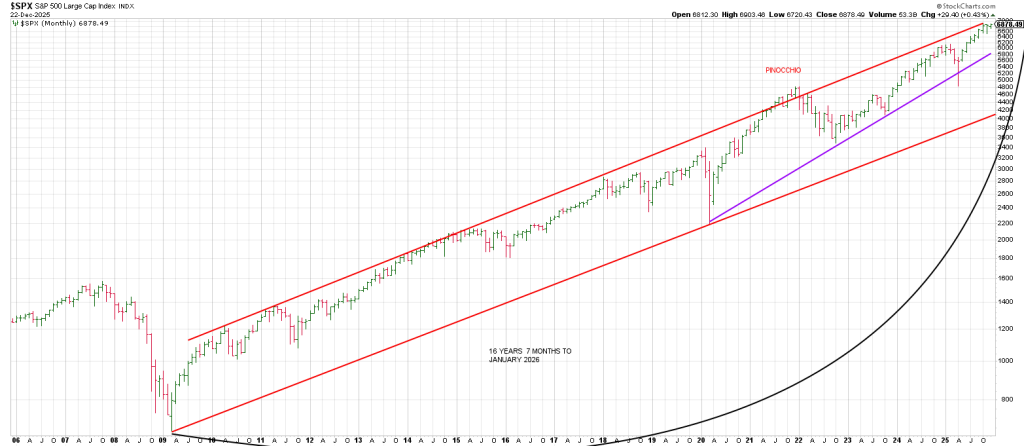
So far, October 2025 has marked a high for the SPX and NAZ.
90 days/degrees from the October 29, 2025 peak is January 29, 2026.
Does that mean the market holds up/advances until January 29th?
Maybe, but we could get a break and a return rally into late January as well.
That said, 9 months or 270 degrees from the April 7, 2025 low is January 7, 2026.
This aligns with the major January 11, 1973 fake-out/breakout that produced a devastating 2 year Bear Market.
Interestingly if we use the aforesaid 16 year 7 month period counting from the major July 1932 Bear Market low we get February 1949 …just a few months from the start of a Secular Bull Market that would last until January 1966,
Does this 199 month periodicity mean anything? Is it just coincidence?
I don’t know but on the Square of 9 Wheel 199 is 180 degrees straight across and opposite October 29. Amazing.
Feelin’ lucky?