“Put your hands on the wheel
Let the golden age begin.”  The Golden Age, Beck
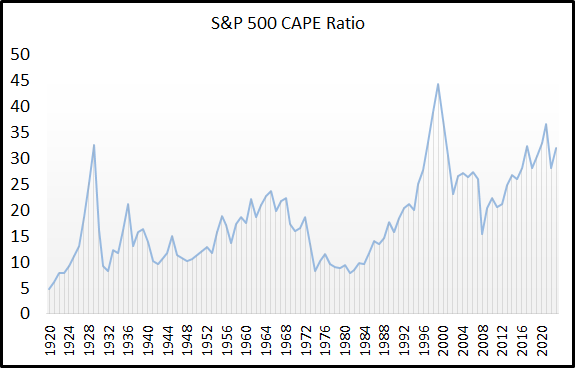
The S&P 500 P/E ratio is significantly overvalued.
Specifically the cyclically adjusted P/E (CAPE) Shiller ratio indicates a significant overvaluation,
Suggesting that stocks may be overpriced based on historical norms.
Market can be said to be driven by three kinds of cycles—market cycles, natural cycles (planetary) and P/E cycles.
For our purposes today we want to see if SPX P/E cycles are validating the other two cycles
There are 3 cycles we want to look at.
1)A 12 year or 144 month Fibonacci cycle.
12 is obviously a key cycle from the Bible. Jesus chose 12 apostles and there are 12 signs in the Zodiac and 12 moonths in a year.
We are 24 years and 3 months from the September 2000 Secondary Top or roughly 2 X the 12 year cycle.
Half this 24 year 3 month period takes us to November 2012. This is the low just prior to the breakout above the March 2000 and October 2007 double tops at 1555 and 1576 respectively.
2)There is a 95 year cycle which is 5 waves of the 19 year Metonic Cycle.
2024 is 95 years from 1929.
3)The 19 year cycle ties closely to the Jupiter/Saturn 20 year cycle of which 3 iterations is Gann’s Master 60 Year Cycle.
There was a Jupiter/Saturn conjunction on Sept 10, 1921, The low for the Roaring Twenties bull run was 3 weeks earlier.
The half cycle ties to the depths of the downturn in 1931.
There were 3 Jupiter/Saturn conjunctions in 1981 setting the stage for the Raging 80’s and 90’s
There was a Jupiter/Saturn conjunction in May 2000, two months after the March Bubble Top.
There was a Jupiter/Saturn conjunction on Dec 21st, 2020.
We’ve walked through the 90 degree plus angles to that date in this space.
Suffice to say the Covid Crash low was precisely 270 degrees earlier on March 23rd, 2020.
This December we are a Fibonacci 1440 days/degrees (4 years) from the Dec 21st 2020 Jupiter/Saturn conjunction
This January we will be 1800 degrees/days or 5 years from the January pre-Covid crash top.
1800 degrees is an opposition.
This is a big deal because the 5 year period has proven powerful in the market’s wheelhouse.
For example, 1932 low to 1937 top and crash.
1982 low to 1987 top and crash.
January 1995 to early 2000 top.
October 2002 bear market low to October 2007 top and crash.
From the early September 1929 top to the early September 2000 Secondary Top is precisely 71 years.
These years represent two spikes on the CAPE Ratio.
We are in the throes of a third spike 24 years from the 2000 spike and 71 years from the 1929 spike.
On the Square of 9 Wheel, 71 is square 24.
Notice that the square-out ties to the end of November.
On Friday the SPX struck an all-time high.
A 10 min SPX for November shows how the 6020 (602) square-out was resistance 3 times in November—until Friday’s holiday-shortened session.
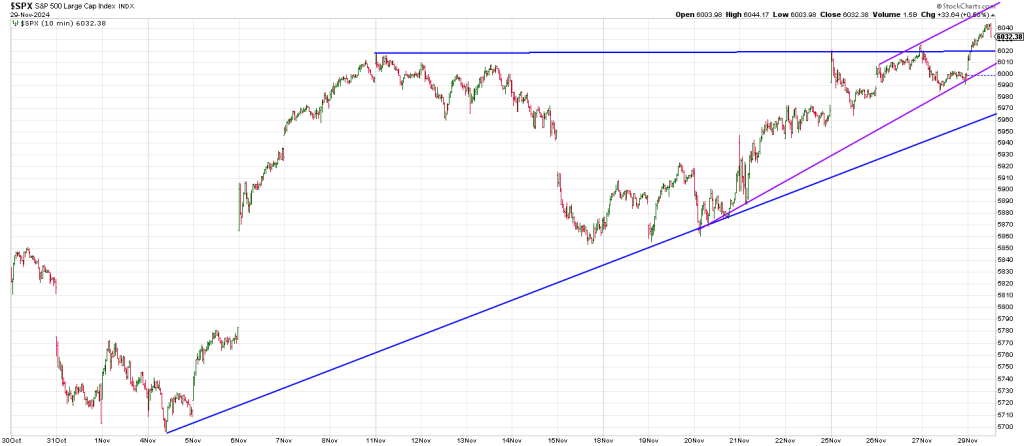
Was Friday a false incremental breakout or does it open the door to the alternative square-out we’ve been flagging at 6160 (616). To recap 616 is straight across and opposite the 666 low in 2009 and square the date of that low, Mach 6h for a potential T-Square (3 element).
Interestingly 616 is on the same axis as December 7th.
We show-cased the significance of the week of December 7th last week.
The top of a small trend channel projects to the 6160 region.
Short-term support resides at a confluence of 6020, the breakout over the 602 square, and the rising purple trend line at 6010.
Clearly breakage back below 6000 puts gives the short term field advantage to the bears…at least for a pullback to the 5960 region. That represents an undercut of the 50 hour moving average currently at 5979.
Any meaningful reversal from here warrants caution—especially a failure below the Trump Gap from November 6th which ties to the 50 DAY moving average at 5838.
While November saw a large breakout in The Truth Teller, IWM, the dailies left a possible Charlie’s Angels sell setup on Friday.
This is 3 Topping Tails in close proximity.
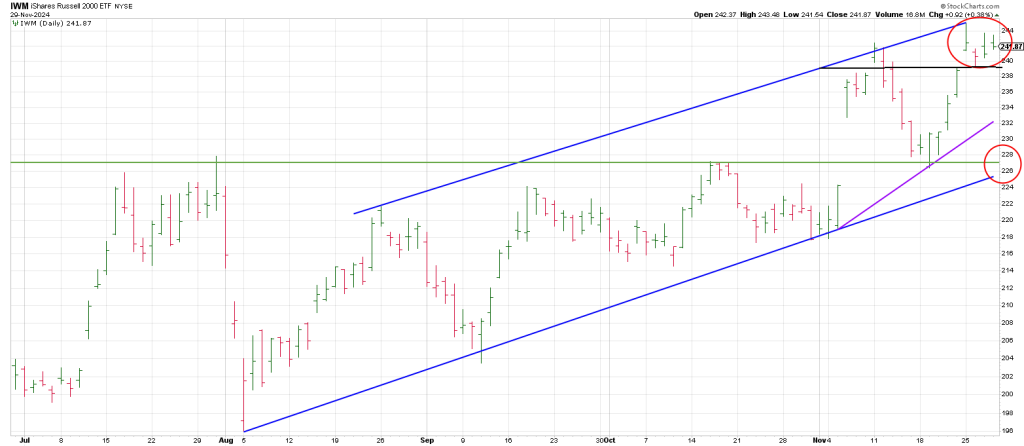
On Monday IWM gaped open but closed near the bottom of the range leaving a Topping Tail.
On Wednesday IWM gaped open but closed below the open leaving a second ‘Tail’.
On Friday IWM gaped open and also closed below the open for a third “Tail’.
As well IWM left an NR 7 Day on Friday, the narrowest range in 7 days.
The normal expectation is to see an expansion of volatility within the next few days.
Breakage below the prior swing high of 242.38 and the open gap from Monday opens the down door.
The Bulls are salivating over a Santa Sleigh Ride into year end:
December is typically a bullish month, especially in election years.
Bullish years (such as 2024) tend to close at the highs of the yearly range.
Such a bullish backdrop can lead to complacency.
To think that clear sailing around CAPE Fear is a foregone conclusion would be wrong.
On the above chart of the CAPE Ratio, you can see the spike in 1929 and 2000 relative to the current cycle.
This is an alert for market participants.
It doesn’t fine tune where the cliff is, but it tells you the conditions are present: the historical parallels drawn to 2000 and 1929 highlight moments of significant market downturns when similar conditions were present.
There are only two ways the CAPE Ratio can come down:
Either earnings are going to soar or stocks must come down.
The entire market rally has been based on P/E expansion.
Ie. optimism. Great Expectations.
S&P 500 earnings are not growing any faster today than they were 20 years ago so there is no rational explanation for the multiple expansion.
It’s based on optimism. Expectations of higher earnings.
The current peak in the price to earnings ratio raises concerns about potential declines.
Historical precedents from 1929 and 2000 suggest a pattern that could forecast similar market corrections if current trends persist.
In sum, we know that the behavior of the NDX from its peak in 2000 mirrored the pattern of the DJIA from its 1929 peak 71 years earlier.
Tomorrow’s report will analyze those two patterns and what price action announced The Cliff.