Throughout 2025 we have believed that a mirror image foldback to 1929 may be in progress that would project to a potential blow off top in November.
November 13 was the bottom of the Crash of ’29.
As well, on the Square of 9 Wheel of Time & Price, the year 2025 aligns with November 7.
The year 2025 (and therefore Nov 7) squares 1982 when this 43 year secular bull market started.
Further 43 squares 2025 and November 7.
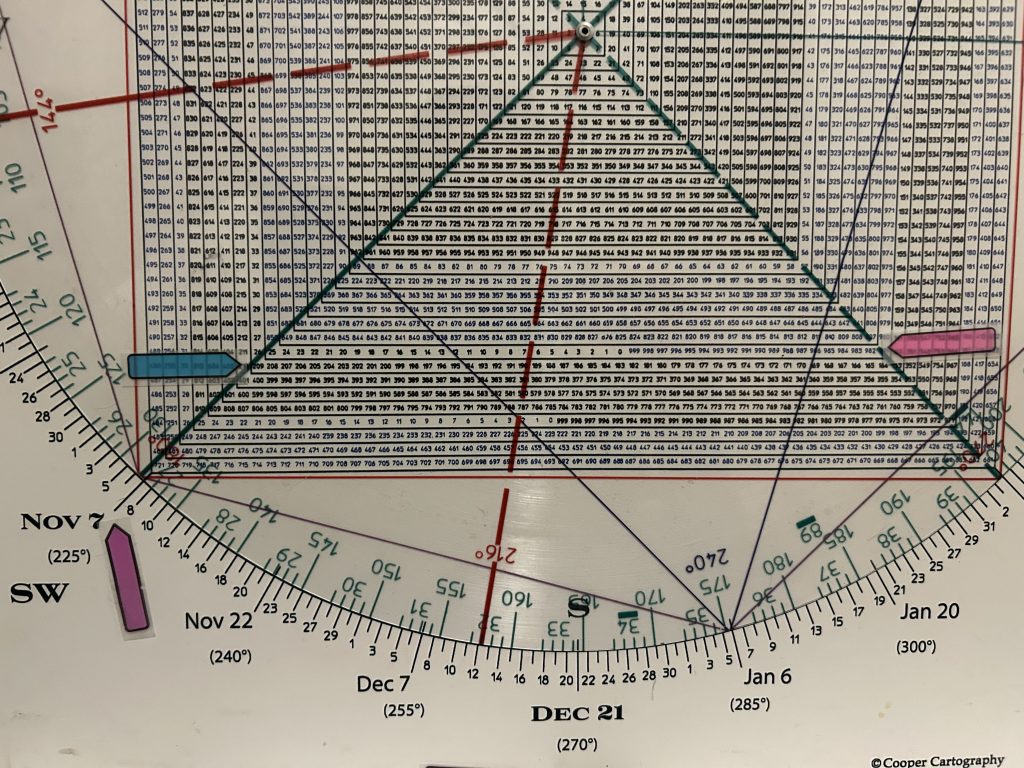
So far the SPX topped on October 29—the day of the Big Kahuna n 1929.
If that should remain the top, it will be wild.
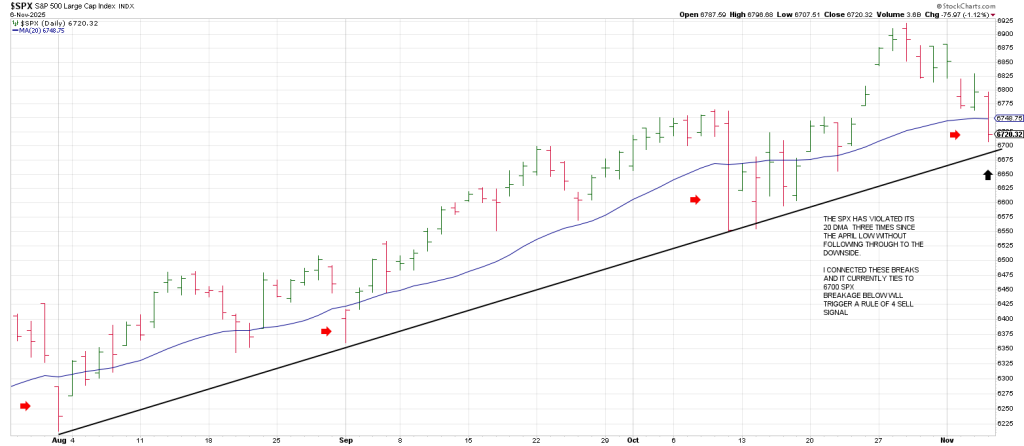
Since the April low the SPX has violated its 20 DMA three times.
Yesterday the index broke its 20 DMA again.
Breakage below this trendline connecting the breaks of the 20 DMA will trigger a Rule of 4 Sell signal.
A Rule of 4 20 DMA so to speak
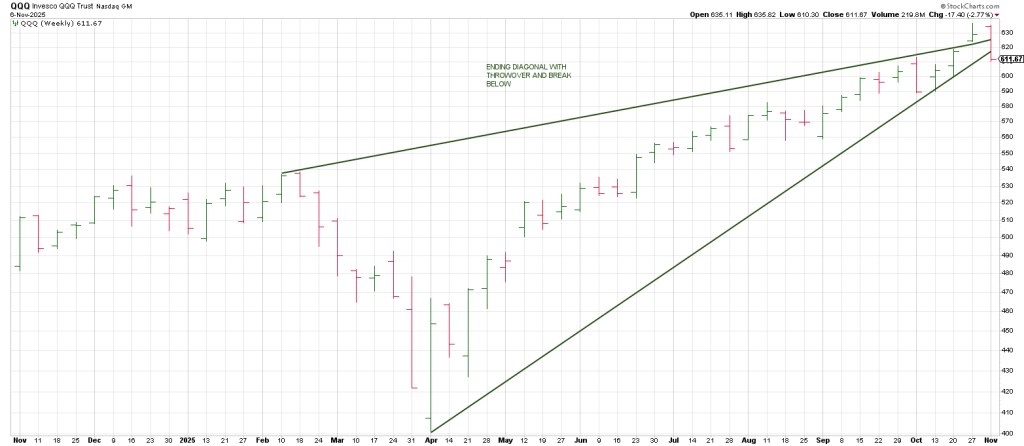
As for the Q’s, a weekly from the February peak shows that they staged a Throw Over of an Ending Diagonal and then immediately reversed this week through the bottom of the ED.
Fast declines typically follow culminations of ED’s or Rising Wedges.
From the all time QQQ high of 637 here are the 90 degree decrements down:
90 down = 612
180 down = 588
270 down = 564
360 down = 540
Interestingly, 640 ties to a test of the 200 day moving average.
The 200 DMA hasn’t been tested since the Q’s gapped over it with authority on May 12.
The Q’s never looked back.
But now having broen their Rising Wedge pattern, the QQQ is flirting with breakage below its 50 DMA.
The 50 DMA has been tested once since the April low.
Today is November 7. We are precisely SEVEN Gann panic periods from the April 7 low on the monthly time frame.
The Q’s struck a low of 610 on Thursday.
Today is a weekly OpEx and today squares 600 on the Sq of 9 Wheel.
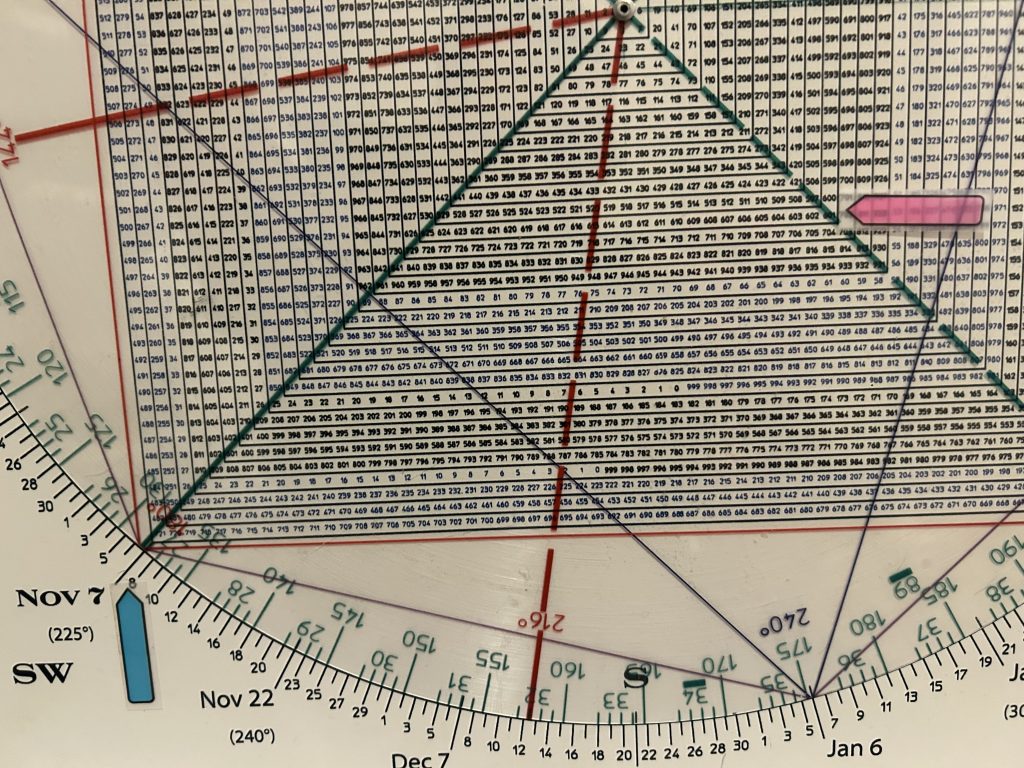
Downside follow through implies potential for a drop to 600 QQQ today/Monday.
Fast moves come from false moves.
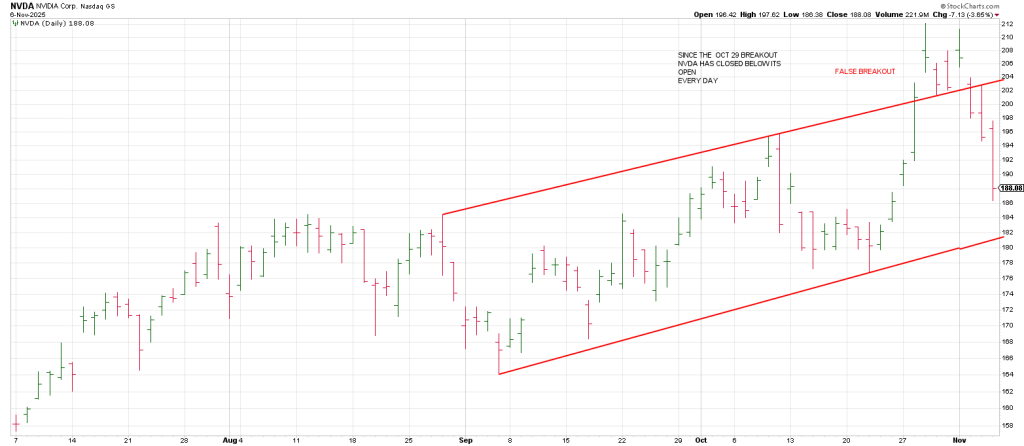
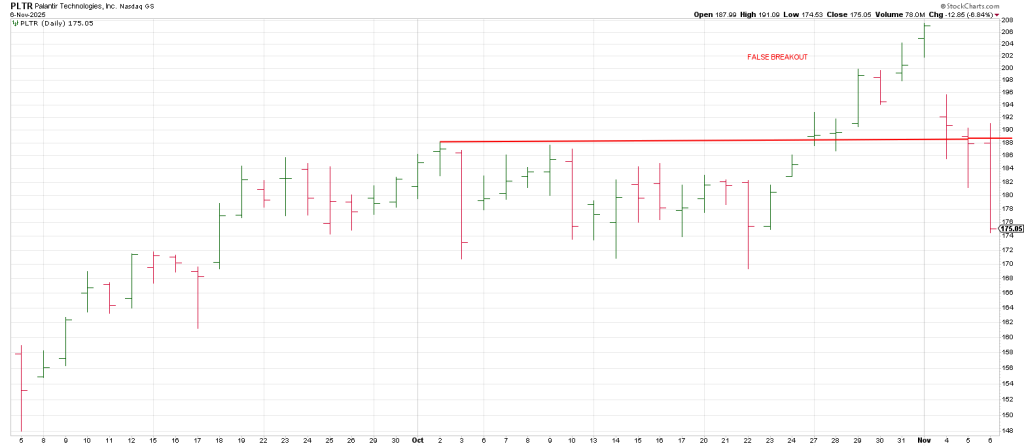
Several key stocks have seen false breakouts.
NVDA broke out and reversed back into a trend channel. It’ set to hit the bottom of the channel at 182.
PLTR broke out and immediately reversed back below The Line.
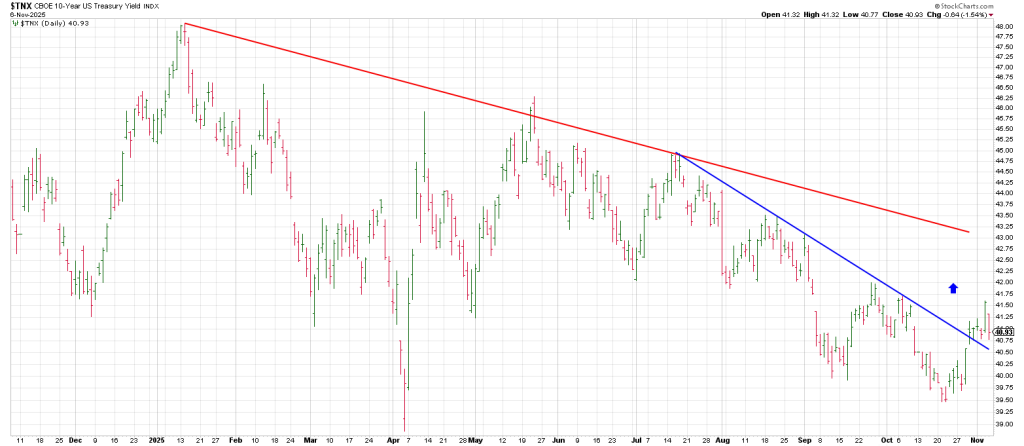
Key asset classes turned in late October.
TNX broke out above a 3 month down trend.
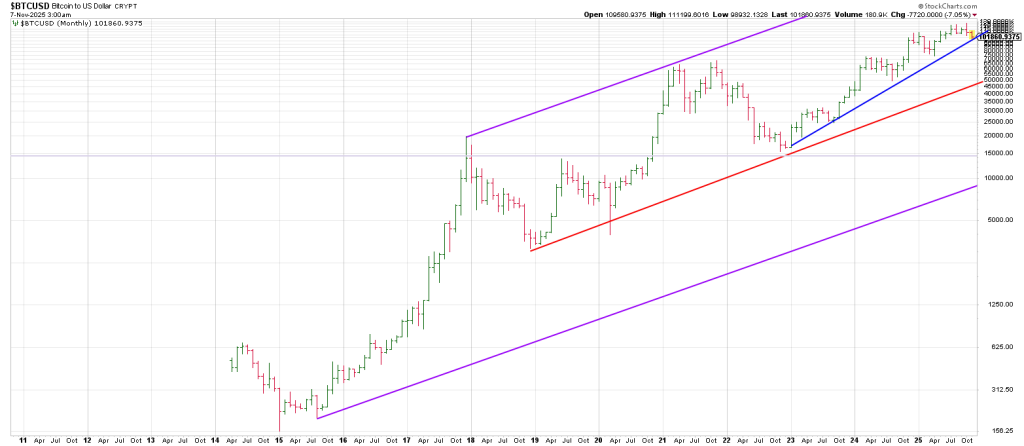
Bitcoin topped in late Oct and has plummeted.
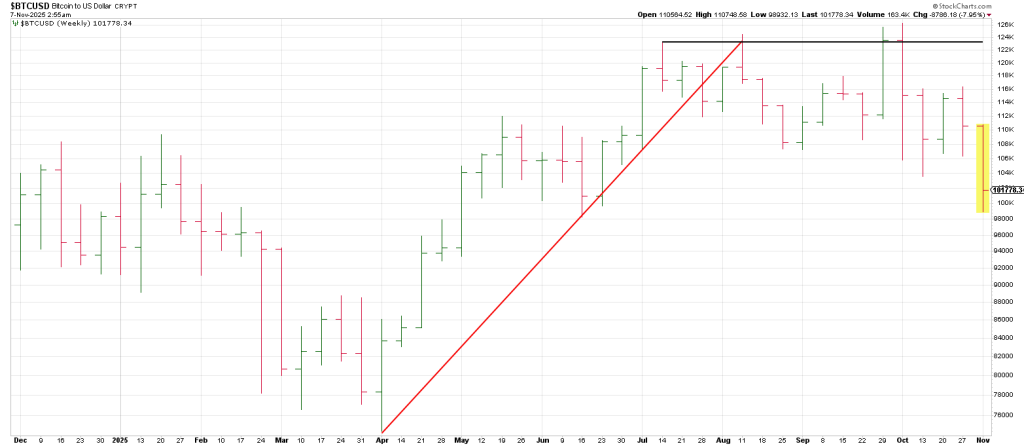
A big picture Bitcoin suggests t has much lower to go.
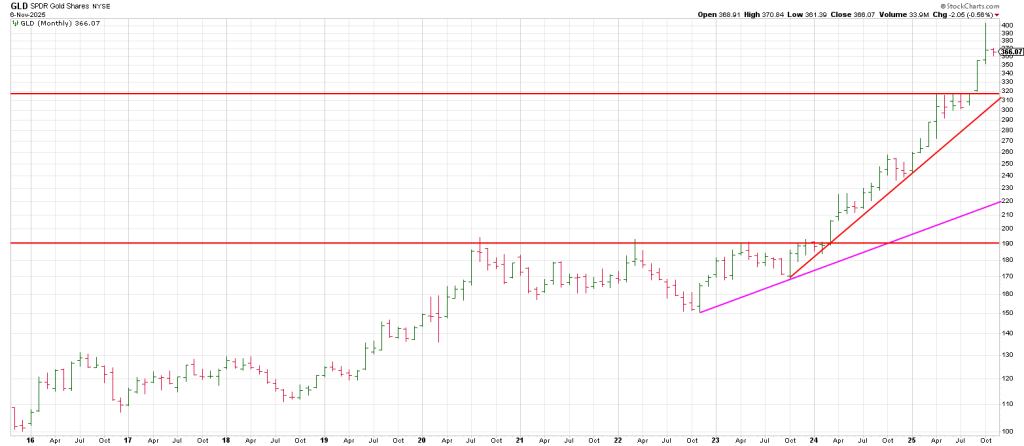
GLD left a large Key Reversal Week in October following a melt-up.
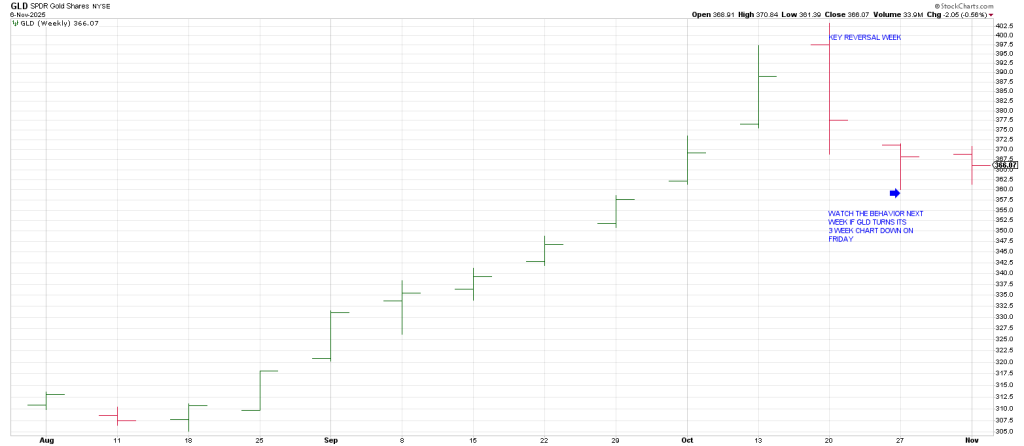
GLD looks like it can test the 320 region.
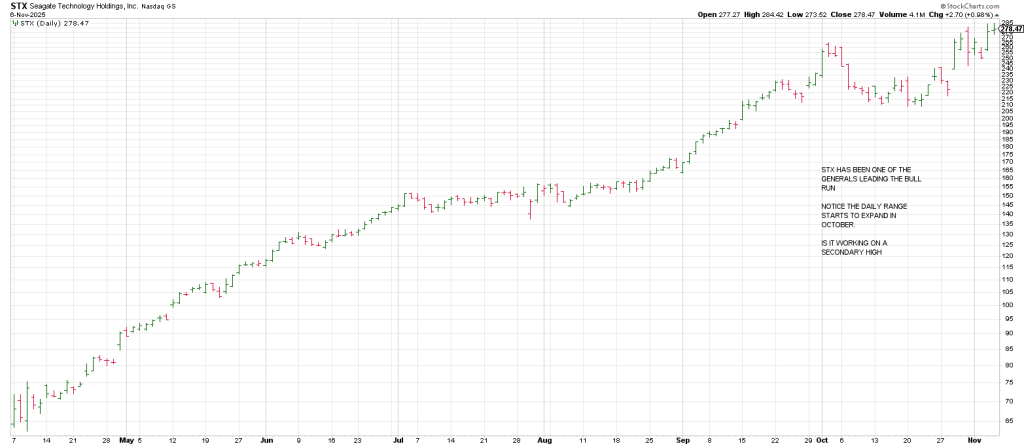
Range precedes price.
A daily STX one of the momentum generals, shows it’s daily range expanded as volatility ramped in the name in October.
Fast moves do come from false moves.
Markets can turn on a dime, most traders cannot.
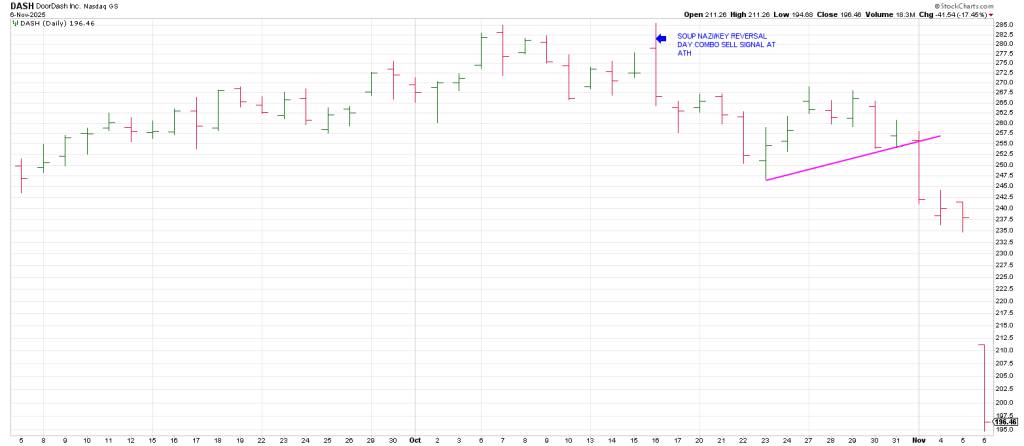
DASH sank on Thursday.
A daily shows a huge Key Reversal Day on Oct 16.
As well, it Jackknifed back below a prior 20 day high triggering a Soup Nazi sell signal on Oct 16.
2025 represents another 5 year cycle culminating from 2020 mirroring the
5 year run from 1995 to 2000 and the 5 year run from 1982 to 1987.
In sum, things change.
Don’t confuse your position with your best interest.
Following yesterday’ carnage, the futes are up 17 as I write early Friday morning.
Typically upside reversals do NOT come from up opening following big Sell Days, they come from down openings.
Heads up on a downside ORB (Opening Range Break).

Square of 9 Wheel
Purchase your own Square of 9 Wheel. Shipping to US only. Contact Jeff for shipping outside the US.