“Within the economic pattern of a period, the tidal ebb and flow of mass psychology in response to the rhythms of environmental change cannot be safely disregarded…Man is, apparently, not so greatly dissociated as he had supposed, from the source of all that enables him to live.” Edgar Lawrence Smith
“Can’t you hear me knocking’?
Yeah, down the gas light street now” Can’t You Hear Me Knocking, The Rolling Stones
“You know, life’s a funny thing. Nobody wants to get old, but nobody wants to die either.” Keith Richards
The market’s a funny thing. Just when it looks like it’s going to go on forever, it dies.
On Monday on the Hit and Run Private Twitter Feed we posted:
THIS
THING’S
GONNA
CRASH
The ruling reason for my thinking this is cycles.
In particular, the 92 years from the JULY 1932 low.
Because the structure from 1932 culminates 5 waves up into 2024, I believe 92 was synchronous with a major top…low to high.
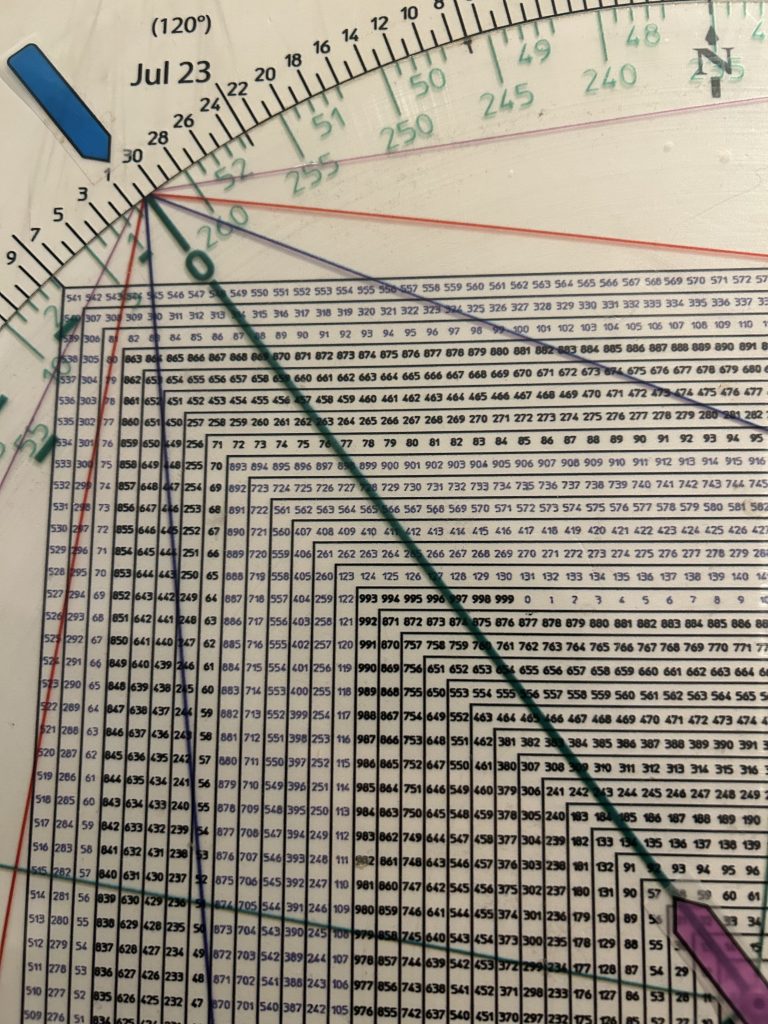
On my Square of 9 Wheel, 92 “points to”/aligns with July 31.
Hit and Run members have been buying puts this week.
Wall Street is consumed with Price…not so much with Time.
When Time hits and turns trend, when cycles exert their influence, Price happens slowly then all at once. Mr. Volatility and his wicked wife Mrs. Whiplash wreck havoc on the tape.
There is no place to run, no place to hide.
No Exit.
Everything…all the little darlings, the sacred cows, the “Magnificent” become the Maleficent.
The virtuous circle of passive ETF buying forcing the purchase of the underlying trillion dollar icons all of a sudden becomes unvirtuous and the spiral works in reverse.
It had nothing to do with value and everything to do with The Story on the way up.
It has nothing to do with values on the way down.
It is experiential unwinding in its purest violent form.
When the whip of Time comes down, there is no place to run and no place to hide.
Funnymentals, narratives and rationales go in the emotional dustbin where all parabolic moves meet their maker.
Wall Street in all its statistical crunching and ivory tower Efficient Market Hypothesis is no match for
Old Man Time.
Hit and Run has been warning The Matador would pull the sword from his cape on the raging bull in July…just like he did 34 years ago in mid-July 1990 and on the half-cycle 17 years ago in mid-July 2007.
Today is August 2nd.
34 years ago on August 2, 1990, Saddam Hussein started a Mid-East War.
Will history repeat with Iran and Israel in hours?
The news breaks with the cycles.
Mr. Market acts like he knows tomorrow’s headlines.
Despite Wednesday’s attempt for the market to gaslight The Bears, yesterday the downtrend reasserted itself with authority.
Fast moves come from false moves.
Wednesday was a gamma squeeze.
Once the shorts were forced to cover and hook was in on the bulls, the market was ripe for a rip to the downside.
In yesterday’s morning report we showed the following daily SPX.
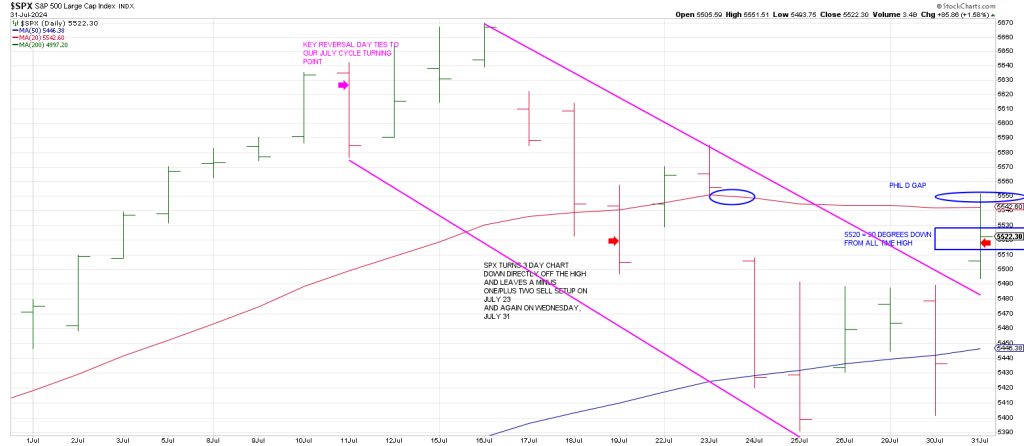
We stated, “On the above daily SPX I drew a declining Tops Line from the ATH to the July 3rd pivot high.
Notice that Wednesday produced a Gap &U Go above this trend line.
A failure back thru this tend line and Wednesday’s gap is the Matador putting the swoard in the bull.”
The sword was 155 SPX points long intraday.
Let’s see what happened and what the SPX dailies look like after the bloodletting.
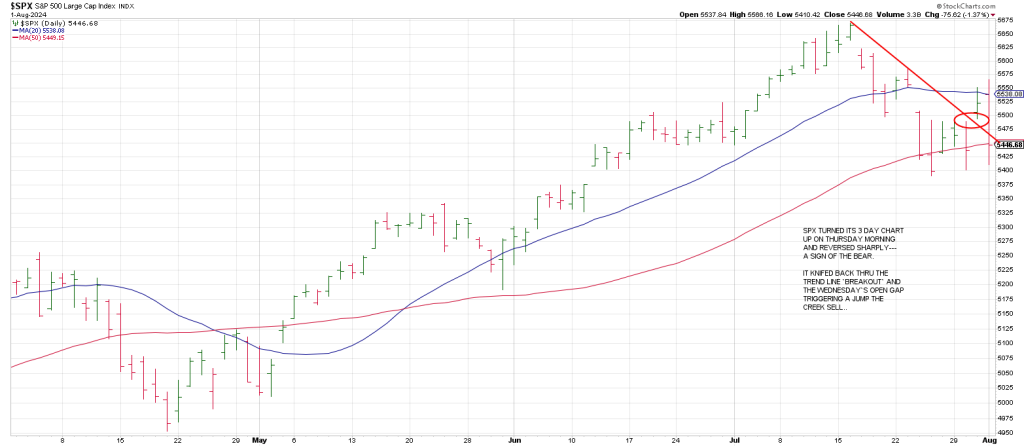
SPX turned its 3 Day Chart up on Thursday morning for the first time since turning down directly off the top.
When the trend is down, a turn up in the 3 Day Chart will define a high soon in terms of time and price.
Yesterday it happened immediately, underscoring the viciousness of the downtrend on the table.
Notice Thursday morning’s rally failed on a Pinocchio of its 20 day moving average.
When the aforesaid trendline “breakout” was reversed in tandem with a failure below Wednesday’s up gap, we got accelerated momentum to the downside.
The SPX was magnetized to its 50 day moving average once again where there are little triple bottoms.
Fast moves come from false moves.
Judging by the futures as I write Thursday night, these “triple” bottoms will be broken on a gap this morning triggering a continuation Rule of 4 Sell signal….a Rule of 4 Sell signal that will occur at the 50 day moving average….on a Friday.
It looks like the SPX Monthly Swing Chart will turn down in the morning on trade below the July low of 5390.95.
If the index fails to produce a knee-jerk rally attempt on the turn down of this big wheel of time, caution is warranted.
A monthly SPX from the January 2022 TOP shows the behavior of the Monthly Swing Chart.
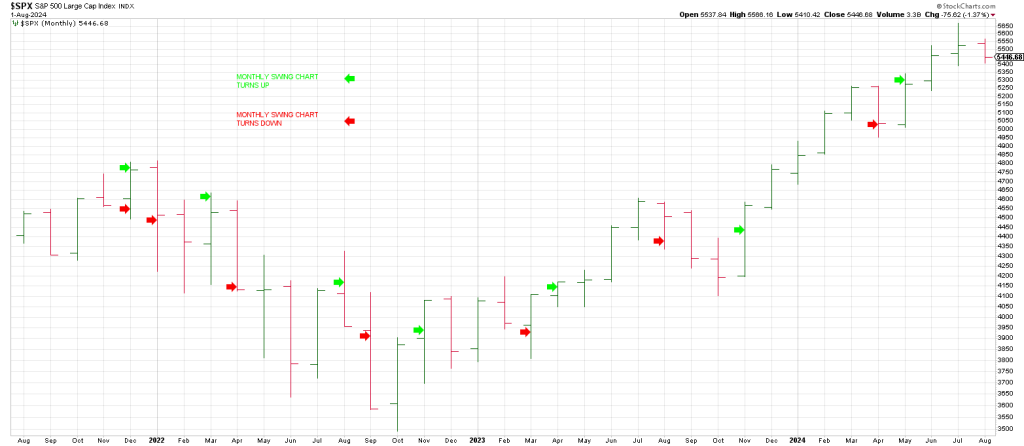
Notice the volatility at the January 2022 top with a Down Up Down Sequence.
Every time the Monthly Swing Chart turned up it defined high in the downtrend.
When it turned up and stayed up off the October 2022 low it was a change in character.
When it turned down in March 2023 it defined a low.
Notably the 3 Month Chart turned down at the October 2023 low perpetuating a blow-off move.
When the monthlies turned down it April it defined a low.
The presumption is the monthly SPX will turn down soon…perhaps today.
The ensuing behavior is going to allow us to take the market’s temperature.
If the SPX extends to the downside after the monthlies turn down, the bull will be in exile.
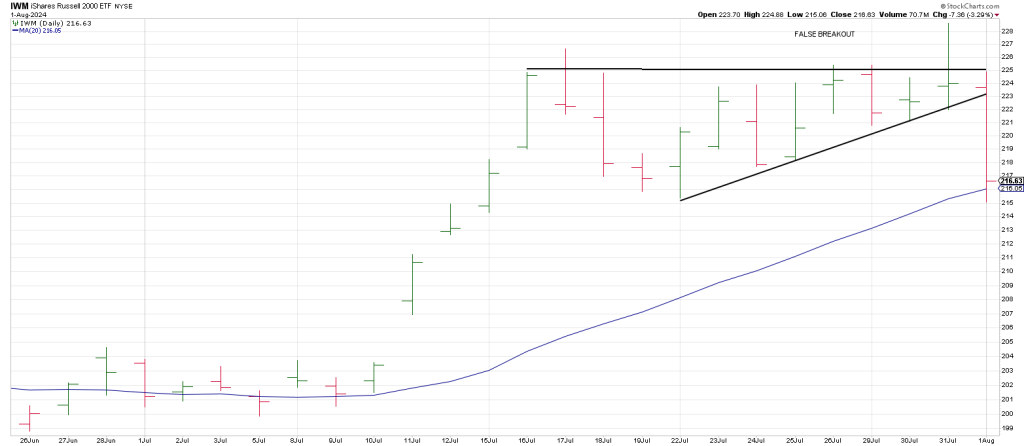
I warned last week that the narrative about the “bullish rotation” into small caps and IWM was a death rattle.
We showed a daily IWM indicating a Combo Sell signal.
What happened?
IWM plunged to its 20 day moving average.
QQQ has driven the down trend.
Let’s take a look at a big picture weekly.
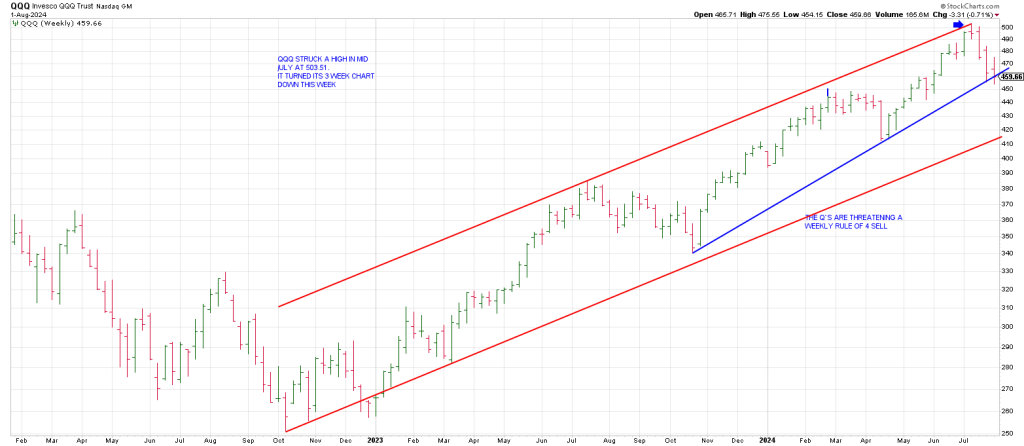
The Q’s are threatening a WEEKLY Rule of 4 Sell, a break of a 3 point trend line.
This typically sees continuation.
Notice that the Q’s turned their 3 Week Chart down this week.
This is the first time the 3 Week Chart has turned down since the rally off the October 2023 low.
This week was the first time QQQ has turned its 3 Week Chart down since the week of August 7, 2023. The Q’s continued lower for nearly 2 more months.
The structure and momentum off the July 2024 top indicate a strong likelihood that the Q’s will see a full 360 degree price cycle lower.
418 is 360 degrees down from the 503.50 all-time high.
A drop to 418 is an undercut of the 200 day moving average currently at 429.
On the above weeklies, 418 ties to the lower rail of the red trend channel from the October 2022 bottom.
On the Square of 9 Wheel, 503.50 and 418 are opposite August 19th.
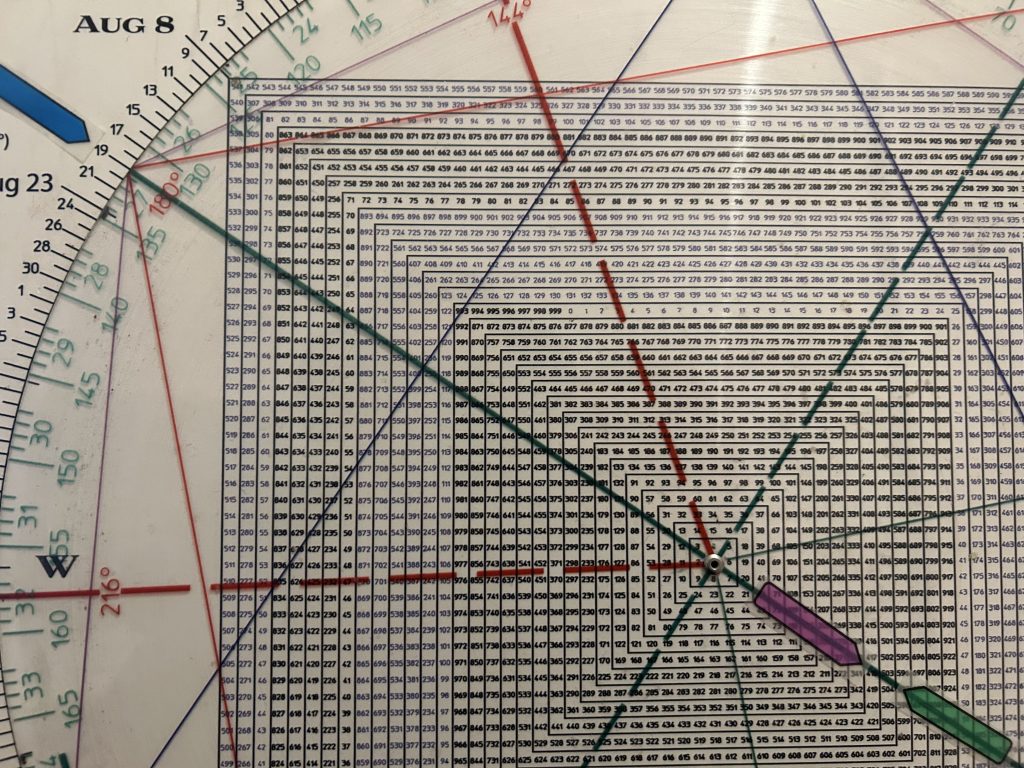
Is it possible QQQ crashes to 418 by August 19th?
Arguably a failure below the prior swing highs from March open the door to the 418 region.
That’s as 17% drop off the high. What’s really important to know is what that means historically…
Something we’ve walked thru for Hit and Run members this morning.
Check out our newsletter to see what’s next. Check out the Hit and Run Private Twitter Feed to see what the price for the plunge looks like and when we expect a crash.