“Yes, I told you that the light goes up and down
Don’t you notice how the wheel goes ‘round?” Badge, Cream
The aphelion is the point in the orbit of a planet at which it is the furthest from the sun.
The perihelion is the point in the orbit of a planet at which it is the closest to the sun.
The Earth reaches aphelion on July 5th, 2024.
The Earth reaches perihelion on January 4th, 2024.
What has this got to do with the stock market?
Allow me to explain. While the ancients told time by the Moon, the modern world tells time by the Sun.
The orbit of the Earth around the Sun is a 360 degree cycle.
W. D. Gann wrote that Time is more important than Price in markets.
In other words Time is more important for determining trend than price.
While these early January and July dates are not necessarily exact turning points on any given year, the pattern formed at these points often telegraphs Mr. Markets intentions.
For example the SPX record high of 4418 January 4th, 2022.
The price action in January’s and July’s often marks trend changes, be it primary or secondary highs or lows.
July 16th, 2007 marked the Primary High before the Great Financial Crisis. The market dropped sharply and then rebounded striking a nominal new high in OCTOBER 2007. (October 11th)
July 16th, 1999 marked an important pivot high leading to a decline into October before the final rally into March, 2000.
July 16, 1990 marked a top from which a 20% slide played out into October 11th that year.
July 24th 2002 marked a primary low prior to the double bottom, yes, on October 10th. 2002.
This was one of the Time Factors enabling me to forecast a low to the day of the Bear Market low that year.
October is 90 days/degrees square July.
In sum these Seasonal Turning points are pivotal. Gann understood this.
On July 4th, I’ll be working on a report for July 5th, that will highlight the significance war cycles and market cycles in July 2024.
Let’s take a look at how markets are shaping up as the second half begins.
The SPX opened strong Monday then declined to 5446 before a rally carried into the bell.
What’s interesting is that Friday on the Hit and Run Private Twitter Feed with the SPX north of 5500 we noted that 5440 (540) squared out with June 28th, Friday.
It didn’t look like there was any shot the index would drop to 5440 in coming hours.
Nevertheless a few hours later on Monday morning the SPX traded to 5446.
The June 28/540 Time/Price square-out vibration magnetized the SPX lower.
An hourly SPX shows the Line of Least Resistance at this 5440 region.
So it’s not surprising that it acted as support as the 5440 region had been well tested throughout June.
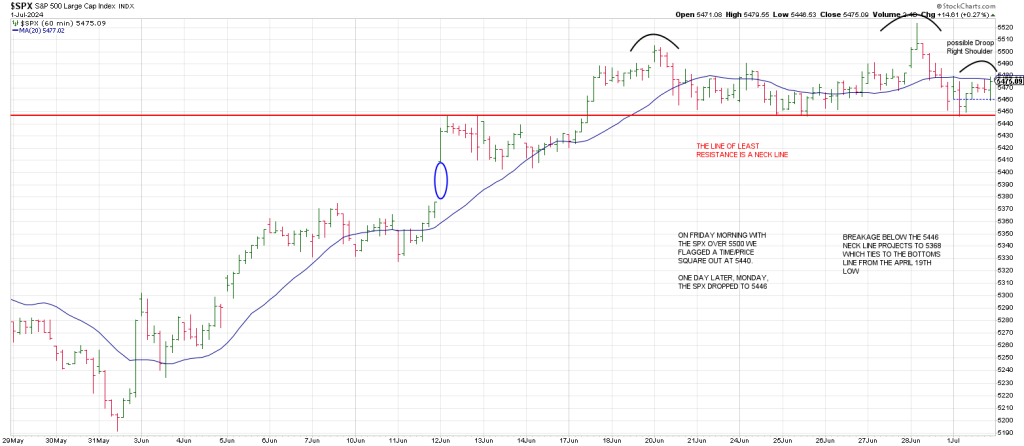
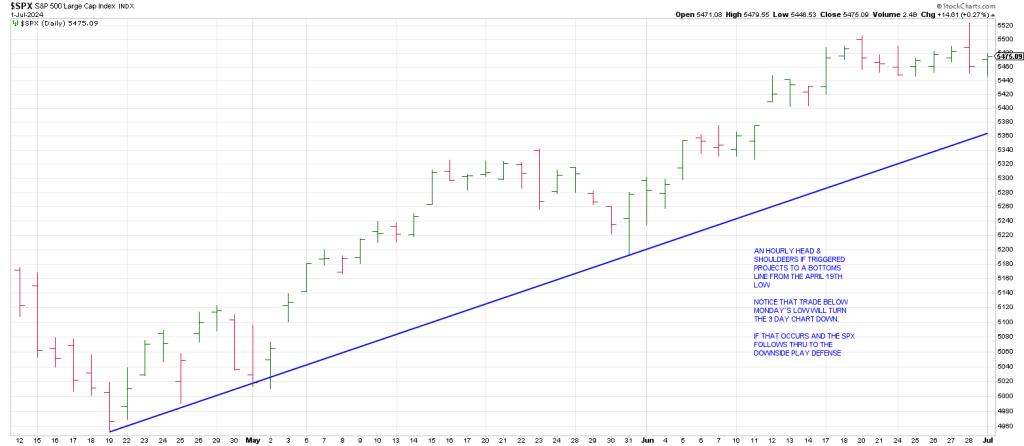
We now have a 3 point horizontal trend line at 5440 that defines a Neck Line of a potential short-term hourly Head & Shoulders top.
Moreover the potential Right Shoulder is a “droop” Right Shoulder. This is a more bearish H&S.
In fact the top in 1929 carved out a droop Right Shoulder on the dailies.
Breakage below the 5440 Neck Line projects to 5368.
That ties to a Bottoms Line from the important April 19th, 2024 low.
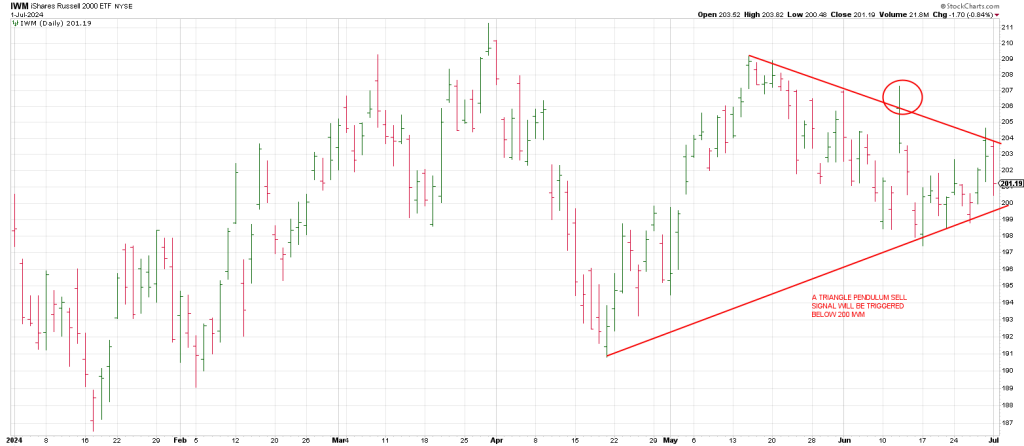
Checking IWM, The Truth Teller, shows a looming Triangle Pendulum sell signal on breakage below 200.
Friday’s SPX Key Reversal Day from a record high rebounded Monday but only 24% of the stocks in the index closed the day higher. Down volume swamped up volume.
It was a narrow rebound.
Apparently Mr. Market took the Supreme Court decision for MAG (Make America Great) as a buy on the other MAG, the Magnificent 7.
Let’s take a look.
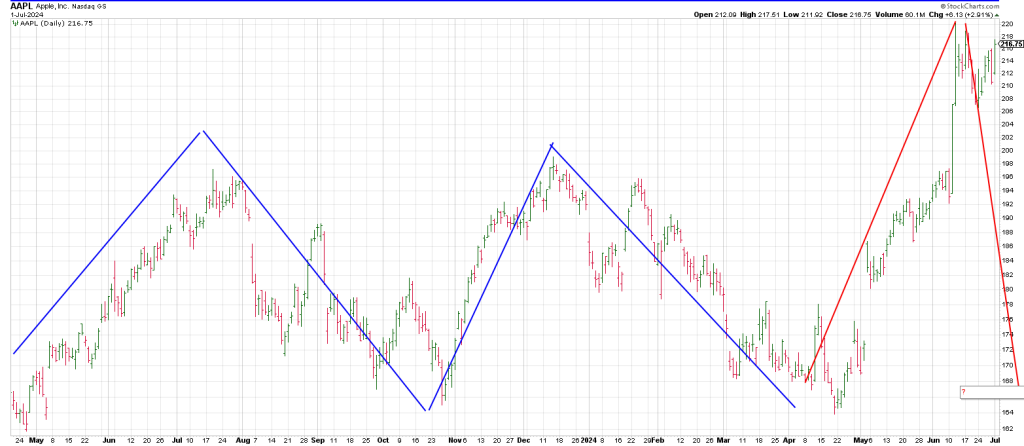
AAPL closed up 6 to a record high buffing out a potential Gann M A Topping pattern
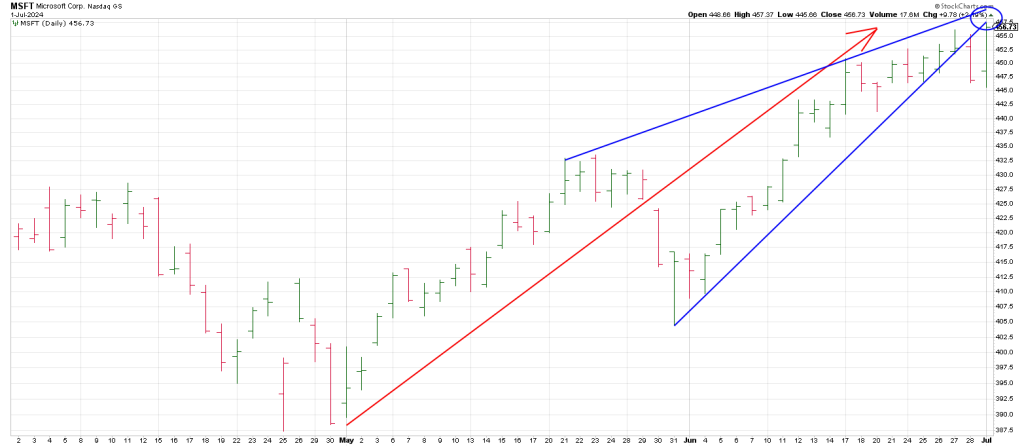
MSFT, up 9.50, left a Reversal New High continuation signal—it left an outside up day to a new all-time high.
It too shows a potential M A Top.
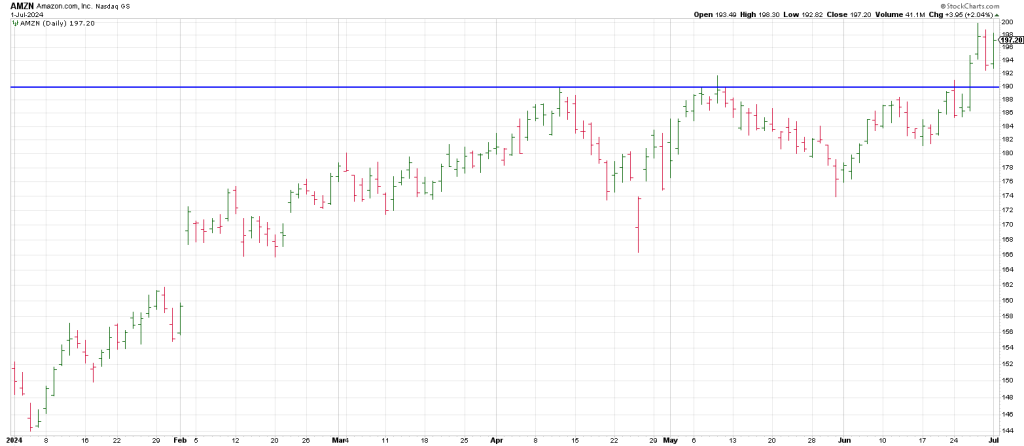
AMZN gained 3.70 following Wednesday’s Rule of 4 Breakout flagged on the Private Twitter Feed.
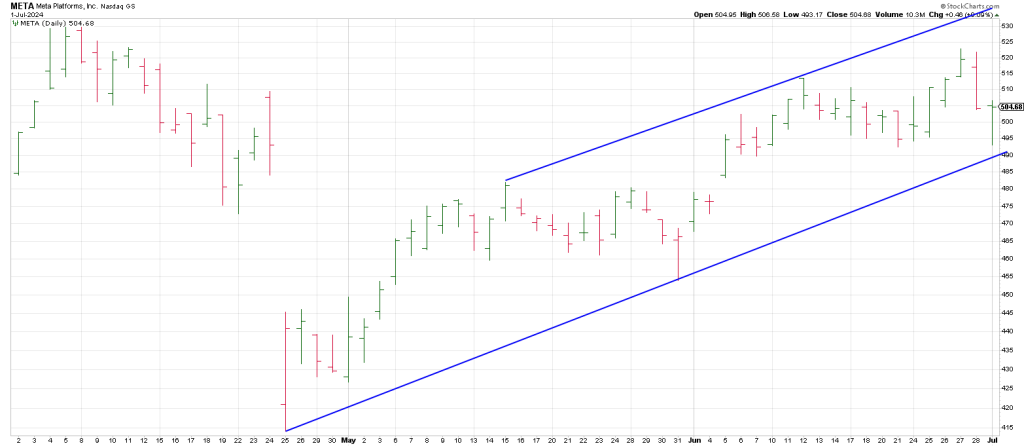
META was flat but rallied back from an 11 point loss leaving a +1/-2 buy setup from an undercut of its 20 day MA.
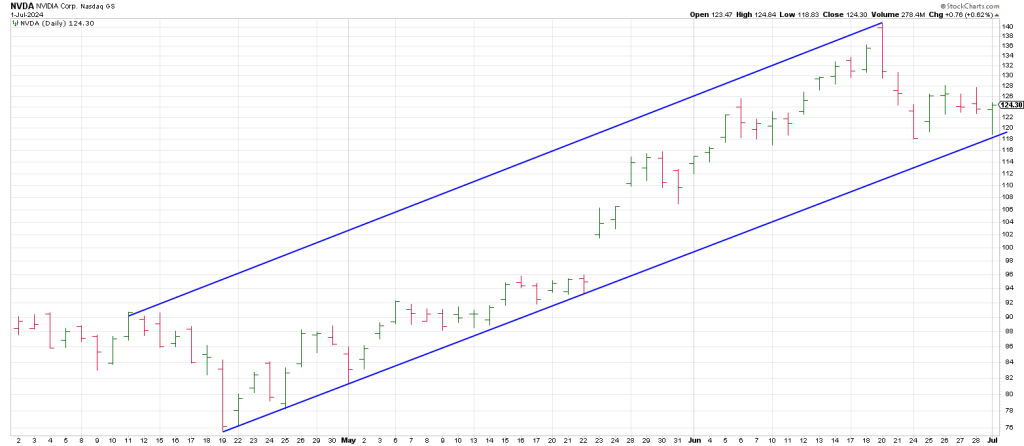
NVDA rallied back after shedding 5 points to testing last weeks low for the move off it’s all-time high
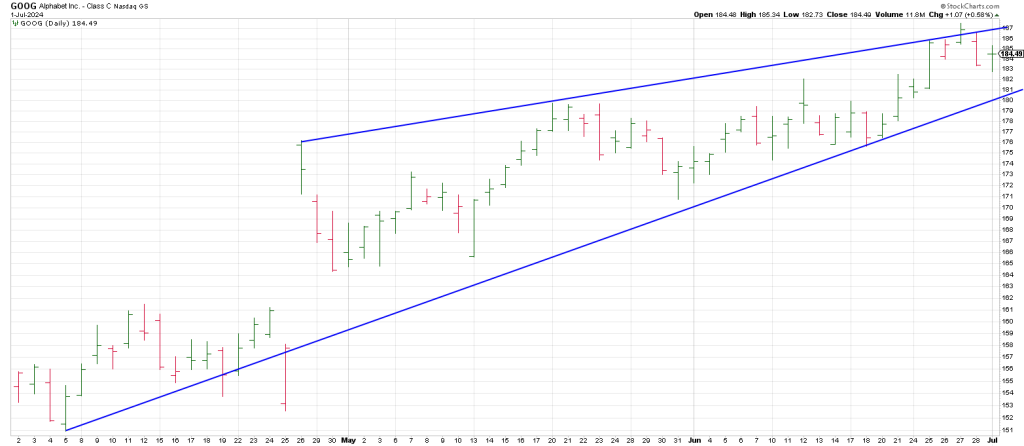
GOOG is also in the Plus One/Minus Two buy position after a pullback from all-time highs
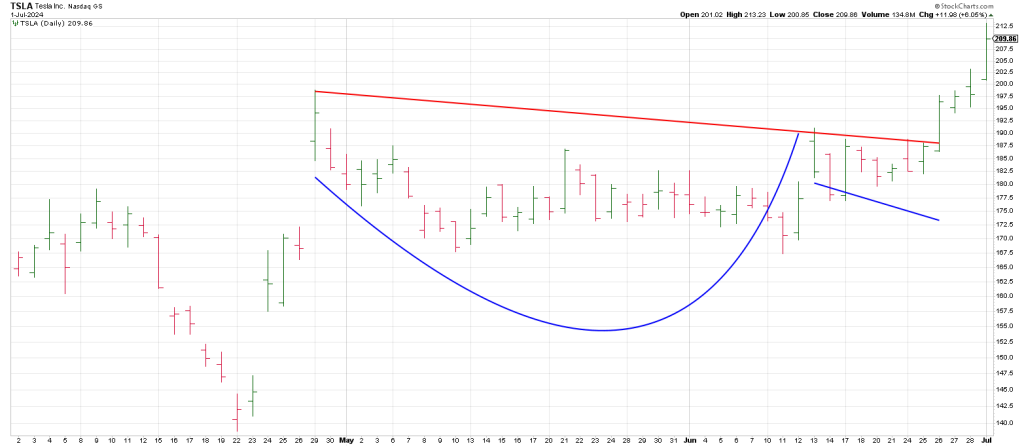
TSLA exploded 12 points following last weeks breakout of a Cup and Handle flagged in this space targeting 218 which is 540 degrees up on my Square of 9 Wheel from the April 139 low.
It closed at 210 hurdling its 200 DMA for the first time since early January.
Technically and based on the Square of 9 TSLA has a path to 245 come mid-July.
I can’t help but wonder if the action in the MAG 7 isn’t more fear than frenzy.
It may be a combination of fear amongst money managers hiding in big cap liquidity along with
Frenzy amongst retail
Be that as it may, the momentum in the MAG’s smarts of a Buying Climax.
A Buying Climax in stocks is exhaustion of demand, the final surge (which can last weeks) as the last buyers enter the market.
A Buying Climax comes about when a stock makes a new yearly high, but ends with a loss for the week.
A Buying Climax is often one of the cleaner signs of the end of a bull market: volume expands to extremes in tandem with a panicky price spike.
Last weeks near Key Reversal Week in the NDX tangential to the rush into the MAG 7 may be the tension on the tape that marks the turning point I expect in July.
Remember, last weeks “in the spirit” of an NDX Key Reversal Week is the first time this pattern has appeared since the top week in November 2021.
The QQQ struck an all-time high of 487 Friday and reversed leaving a Key Reversal Day.
A Sq of 9 shows that 488/489 is 180 degrees straight across and opposite October 26th for a Time/Price square-out. if the Q’s should push higher over coming days caution is warranted.