This week is 180 degrees/days opposite the April 7 low.
WD Gann was the first to show how these natural solar divisions of the year (90, 180, 270 and 360 degrees) often coincided with turning points in markets.
For example the internal high prior to this year’s February 19th pre-crash high was January 23.
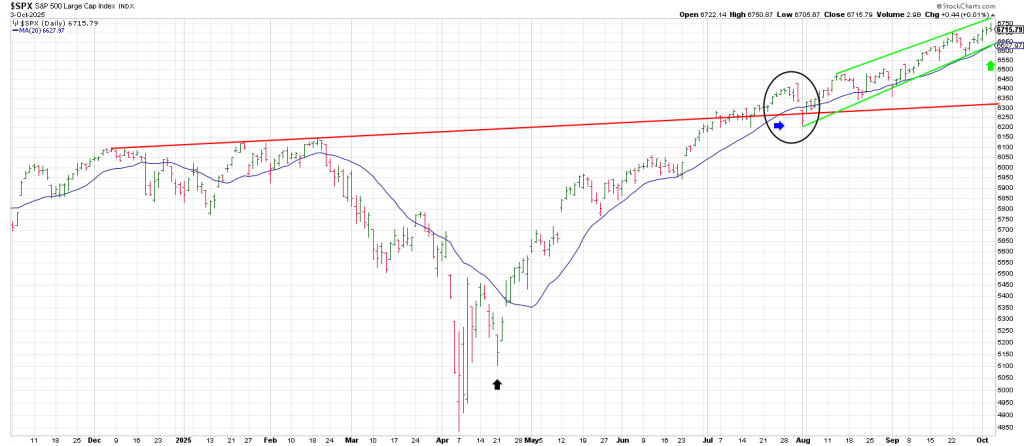
Checking a daily SPX shows April 21 marked a successful test of the April 7 low.
The SPX exploded immediately from that test—90 days/degrees from the Jan 23 ‘internal high’.
An internal high is like a Primary High following which there is distribution and divergence when a rally test that initial high typically over 2 to 3 weeks.
March 25, 2025 the SPX carved out an NR 7 Day (Narrowest Range in 7 Days) which in truth marked. the waterfall decline of the down turn from the Feb high.
Approximately 90 days/degrees from the March 25th pivot is June 24th when the SPX gapped open igniting momentum which persists to this day.
After sleepwalking for 6 weeks since the mid-May high, price action on June 23 (Holy Grail/LROD) and the June 24 gap marked the beginning of the move that would perpetuate a breakout over key resistance.
This resistance is defined by a trend line connecting the December 2024 high and the January/Feb 2025 highs.
That trend line was cleared in late July 2025.—90 degrees from the April 22 pivot we pointed out earlier—the successful first pullback low/test of the April 7 low.
So this week is potentially pivotal being 180 days/degrees from the April 7 low of the year.
As well we have a “hidden pivot” around October 22 which is 180 degrees from the April 21/22 test
And 90 days/degrees from the July breakout.
The July breakout spoke volumes based not just on the time count from April but also by its price action.
Here’s a close up below.
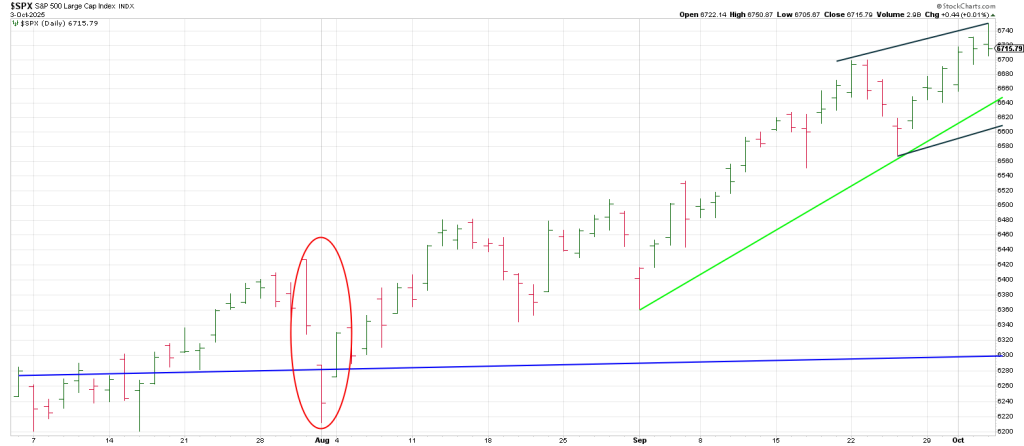
The SPX broke out “above the line” then gapped below it as if failure but immediately pulled itself out of the brink.
Fast moves come from false moves and the index has been in ‘momentum dissonance’ since.
Since the false breakdown on August 1, the SPX has carved out 3 pullbacks—each essentially test/undercutting the rising 20 day moving average.
I don’t call it the Holy Grail for nothing.
Currently there is a 3 point trend line in progress.
When that is broken, something will be afoot on the downside.
This week that breakdown level is at the 6630 region and, surprise, surprise, ties to the 20 day moving average.
At the same time the SPX has coiled into this 180 day/degree count from the April 7 low, we know that Friday it satisfied two cycles of 360 degrees from the 483 (4835) low.
As we showed last week in this space, 360 degrees up from 483 is 575 (5750).
720 degrees up from 483 is 675 (6750).
The SPX rang a bell telegraphing higher with a momentum gap through 5750 as it recaptured its 200 day moving average on May 12.
On Friday the SPX struck 6750 on the nose and reversed closing at 6715 near session lows.
In so doing the SPX left a Lizard sell signal—a 10 day Topping Tail.
Not all Lizard sell setups are created equal. Friday’s carries the weight of the time factors and price levels described above.
October may be showcasing an eerie precision.
It’s a market of stocks, not just a stock market.
Checking several momentum leaders over the past several months shows signs of fatigue.
CRDO shows several distribution days from its Sept 18 top.
Friday it tried to rally but quickly failed unable to reclaim its 20 DMA and leaving a Minus One/Plus Two sell setup.
STX left a Gilligan sell signal on Thursday and an inside down close on Friday after a rally attempt signaling perhaps that Wednesday’s large range was a Buying Climax (at least for the moment).
SNDK another momentum general left a Lizard sell signal on Friday after leaving a Gilligan sell on Thursday.
That said it left a Lizard sell signal on September 30, but exploded to the top side after trading 12 cents below the Sept 30 low.
Be that as it may SNDK has 3 reversal days now out of the last 4 sessions for a possible Charlie’s Angels sell pattern.
TSLA has reversed hard off Thursday’s gap up high.
It tested its 20 DMA on Friday and rallied nicely.
PLTR got hit hard on Friday potentially destroying a Cup and Handle pattern unless it pulls its act back together quickly.
And Mag 7 name META hasn’t made a high in 7 weeks. It is sporting what looks like a double top.
Friday it carved out a Minus One/Plus Two sell setup mired below its down-slopping 20 and 50 DMA’s.
Below the open gap at708/709 opens the door to the 200 DMA at 667.
These are just a few signs that volatility is due to come out of hibernation.
A daily VIX below shows an interesting 6 to 7 month pattern suggesting a downside fuse could be lit at any time.
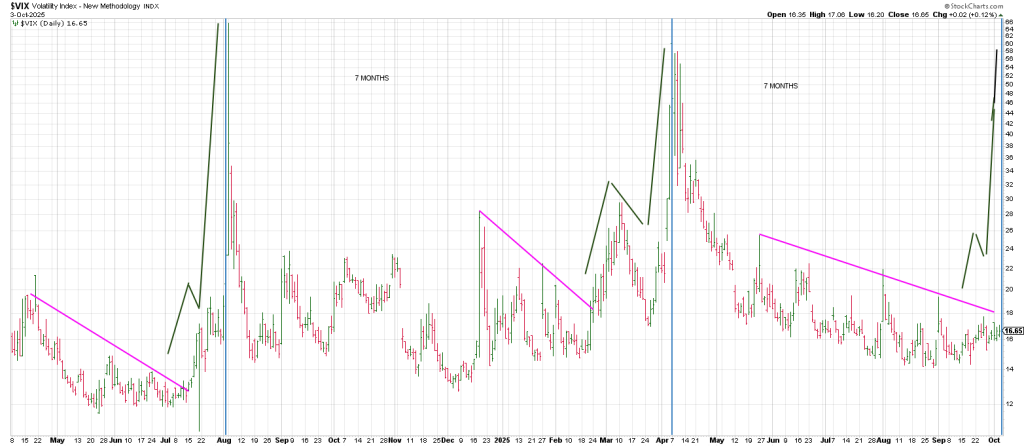
Beneath the glassy headline of a week of new record highs, there was a critical shift taking place:
The VIX rose for the week even as the SPX closed higher—a rare and historically significant occurrence