“It ain’t no use to sit and wonder why, babe
If’n you don’t know by now.” Don’t Think Twice It’s Alright, Bob Dylan
The market rallied for two weeks into Powell’s lip service at Jackson Hole.
Of course, the rubber band was pulled back big league before Hand.
That’s one way to jack up a speech.
Why the need, the need for speed?
5 of 6 Powell Jackson Hole speeches saw the SPX drop 7.5% on average in the next 3 months.
As well, let’s not forget the Yen Carry Trade. The Hand wanted to get the market as far away from the breakpoint as possible.
Mission Accomplished.
The big question: who is left to buy? Clearly not the shorts who have already been scorched shorting into the retrace. They’ve had a Come To Jerry Moment.
The longs who got stopped out in the early August rug pull and had to scramble back in are loaded for bull again—right in time for the seasonality with a capital “S”.
Specifically, the end of August/early September marks the Tent Pole Tops in 1929, 1987 and the major Secondary Top in 2000.
As well:
August 1937 marked a pre-crash high.
September 1919 marked a pre-crash high.
September 1909 marked a pre-crash high.
The DJIA was already in a down trend in 1907 but it crashed from August to November that year.
Anniversaries? Try forgetting one.
Many market participants are buying into the idea that the recent surge and breadth thrust from early August is the start of a new uptrend.
It’s hard to argue with upside breadth and volume but it was hard to argue with the downside breadth and volume on August 5th.
Could we be seeing exhaustion, a Buying Climax?
Is the rooster crowing at the break of dawn doing a duet with the Fat Lady?
During violent market whipsaws there is no clear definition of the trend.
While these extreme moves offer a lot of opportunity on both sides, it is important to appreciate just how deadly extreme whipsaws can be.
While the opportunities are huge during violent whipsaws, you must learn to pull the trigger quickly—both getting in and out.
At the same time it’s important to appreciate you don’t have to make trades all the time.
That’s hard to do when the moves are massive and tempting during these gyrations.
The solution I suggest is narrowing one’s field of vision. In other words focusing on fewer names whether day trading or swing trading during these periods.
The big winners will reveal themselves. Our job is to have the cash available.
Trade less and wait for the best setups versus gyrations.
In the beginning and middle of cycles we get nice base breakouts telegraphing trends.
In late stage cycles, such as we are in currently, we get shorter term Bull Flags and Bear Flags.
The Runaway Moves and Blow-offs that top off late stage cycles see whipsaws increase to become whiplash.
Gann wrote about this phenomena.
“The most money is made when fast moves and extreme fluctuations occur at the end of major cycles.” W.D. Gann
“EXTREME FLUCUATIONS AT THE END OF MAJOR CYCLES”
This tells us the nature of the market we’re in. It can literally do anything.
We got the Flash Crash right on schedule as forecast plunging to our SPY August 5th/ 508 Time/Price square-out.
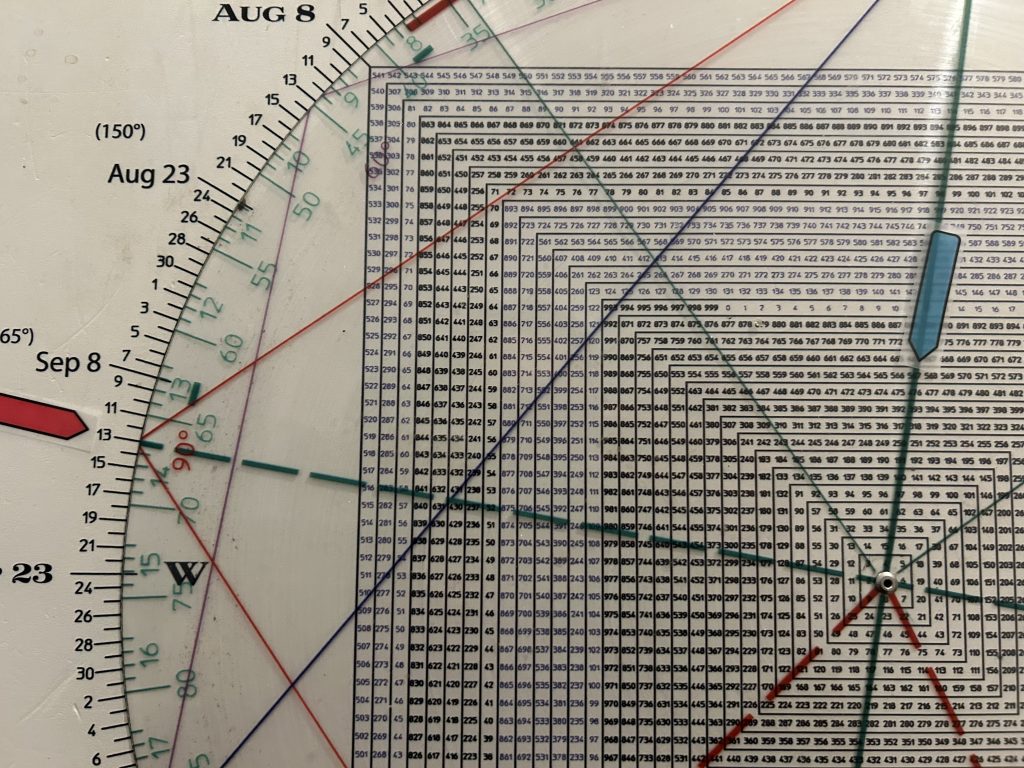
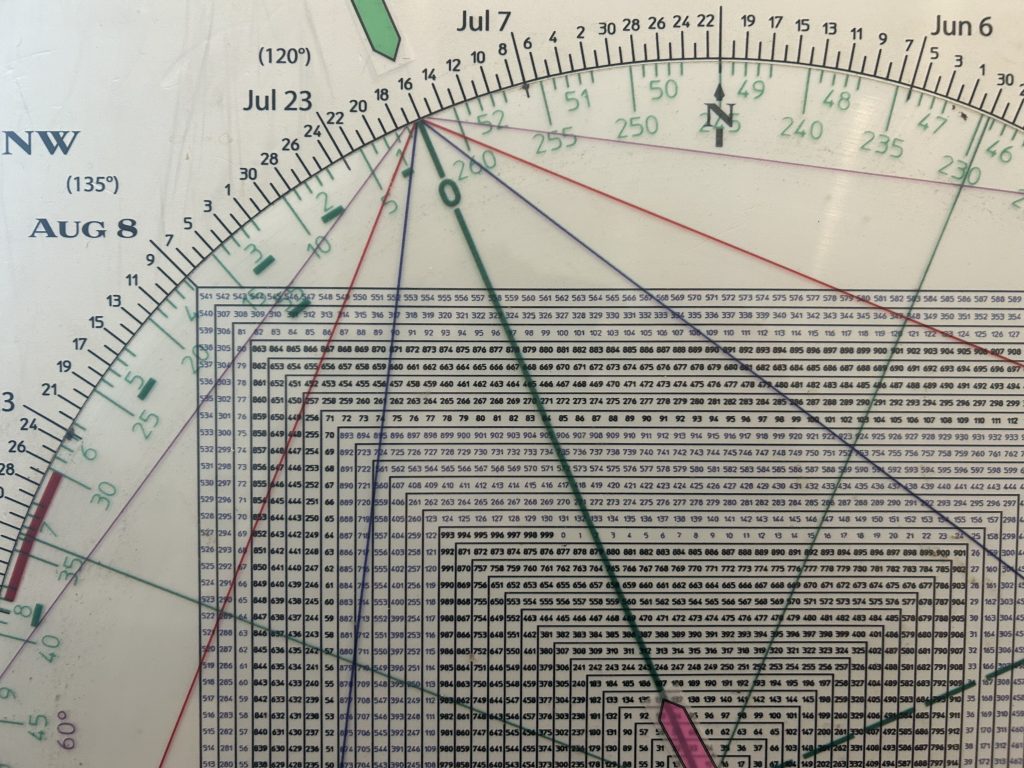
The Square of 9 Wheel proved its value once again as Hit and Run members closed out all SPY puts on the open on August 5th.

Square of 9 Wheel
Purchase your own Square of 9 Wheel. Shipping to US only. Contact Jeff for shipping outside the US.
I don’t know anyone that thought we could be back near the prior highs this quickly—
A 10% advance in 12 sessions.
Friday was the 14th trading day from low, and closed a tad higher than Wednesday’s high, but essentially the advance racked up an 10% gain in 12 trading days.
It’s been a “V” for the ages.
Every once in a while the market does something so ludicrous it takes your breath away.
In the span of 1 month this summer the market has taken our breath away twice.
Inhale. I don’t think it’s done.
September is the end of a quarter. Given performance considerations and long positions getting jettisoned in early August, if we continue to rally past the first week of September the potential is there to extend into the end of Q3…mirroring the Airpocketism off the July 2007 Primary High and the return rally back to a Secondary High in early October 2007.
That said the wave structure and vertical nature of the advance where the SPX has only traded below a prior day’s low once (last Thursday) since the August 5th low argues for a serious downdraft from current levels even IF one more good high is on the table.
As well, the Gann Panic Window counting from the July 16th record high ties to August 26th thru September 9th.
Interesting with NVDA reporting after the bell on Wednesday, in the heart of the Gann Window.
This mid-September period is notable as it squares 567, the July Primary High (5669-70).
Alternatively, the count for a possible Buying Panic counting from the August 5th low puts the Gann Panic Window in the mid to late September zone.
Pick your panic window.
I have a rule which states that after a waterfall decline, there is a strong likelihood that a V Bottom is playing out if 50% of the decline is reclaimed.
This pattern typically sees a retrace to the prior highs…if not new highs.
If we see new highs, it will depend upon The Cycle whether a meaningful extension is called for or whether we simply get nominal new highs as was the case in October 2007 above the July 2007 peak.
A nominal new high could be considered say 3% above 5669.
It is worth noting that the Primary Bottom of the last Bear Market occurred on November 21st, 2008.
The Secondary Low was March 6th, 2009.
While the decline below the November 2008 low of 741 was sharp—10%–the Undercut below the November low was only 6 days.
Is it possible the SPX extends its Runaway Move 6 days beyond the July peak of 5669 into early September marking a Throw-Over?
As Gann would say, “As above, so below.”
On the week of March 9th, 2009 the SPX produced a WEEKLY Soup Nazi buy signal.
Why?
It struck a new 20 week low. but the next week Jackknifed back up through the November low.
“No Soup” for the bears.
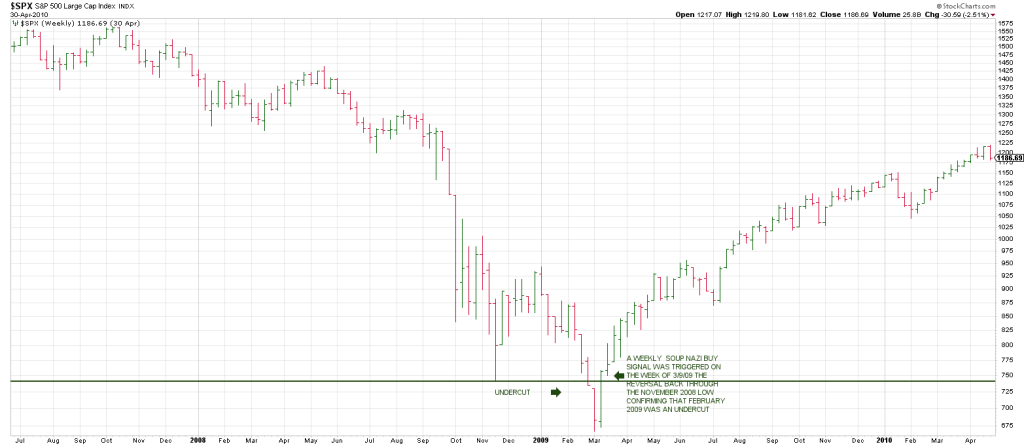
The market never looked back.
Gann was an aggressive swing trader stating that it was important to key off the weekly charts.
However, interestingly Gann also advocated the “main trend” is defined by the monthly charts.
Checking the monthly SPX Swing Chart from the start of the last Primary Bull Market in 2009 shows a low close for the prior Bear Market in February 2009 at 734 SPX.
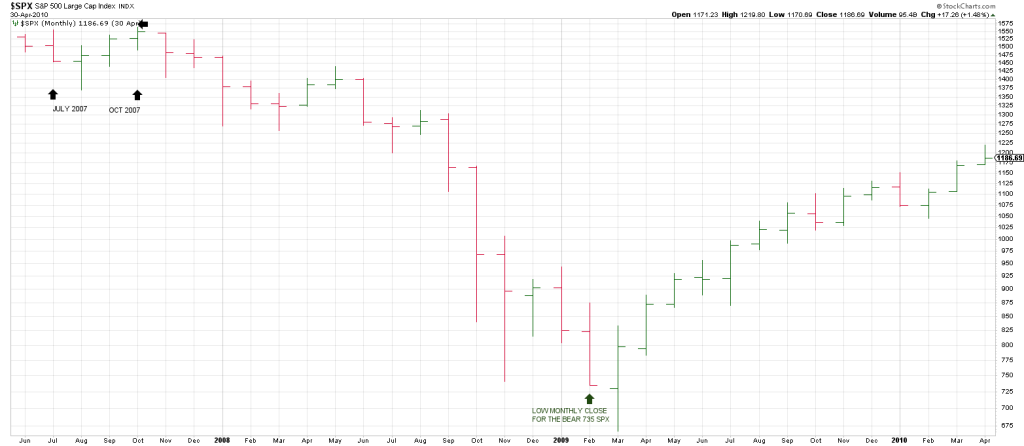
From the monthly closing low in February 2009 to September 2024 is 187 months.
187 “points to”/vibrates off July 16th, what I think is likely the Primary Top of this cycle…whether a higher Secondary high is scored ala 2007 and 2020.
Despite the seeming chaos there is an order at work…just as History is not a series of random events but interconnected patterns that illuminate a larger story.
In sum, the downside pivot should a pullback get going is the 5450 to 5525 region.
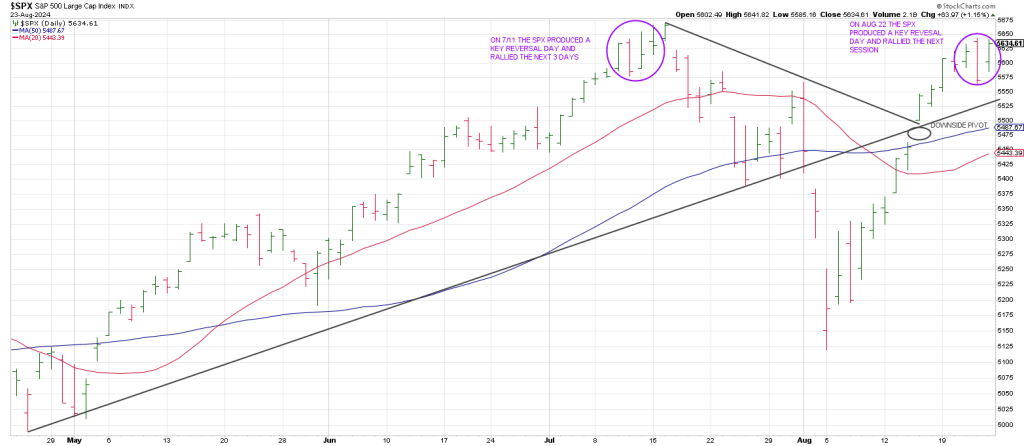
This downside pivot ties to the 50 day line and the open gap from August 15th.
As well it ties to the Tops Line off the July 16th high.
With a long holiday weekend approaching and the price action mirroring the top in July with a rally attempt and top a few days after a Key Reversal Day on July 11th, whatever the reaction is following NVDA’s earnings on Wednesday night, it is likely to produce a trend into the weekend.