“A star lit up like a cigar
Strung out like a guitar” Elevation, U2
“Fundamentals might be food for the first third or first 50 or 60 percent of a move, but the last third of a great bull market is typically a blow-off, where the mania runs wild and prices go parabolic.” Paul Tudor Jones
If you’re lost in the forest, not any map will do; you need the right map.
Hit and Run’s daily Roadmap has been killing it.
When the futures were down 50 points before Wednesday’s open, how many professionals in this business would have told you that the SPX would hit a new record high on Wednesday, the day the government shut down.
I know one. The daily forecast model I create that I call Mr. Roadmap.
Hit and Run members get the benefit of his daily projects every day.
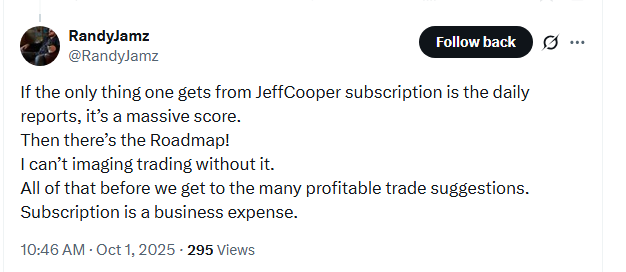
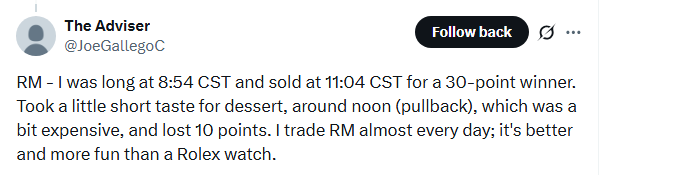
Here’s what Hit and Run members have to say:
Here’s what Mr. Roadmap forecast for Wednesday on the Hit and Run Private Twitter Feed Tuesday night:
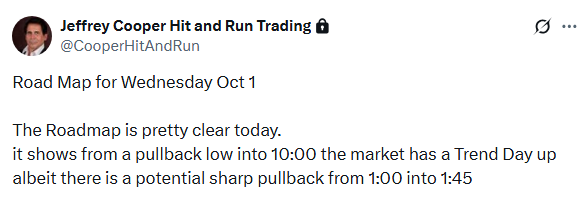
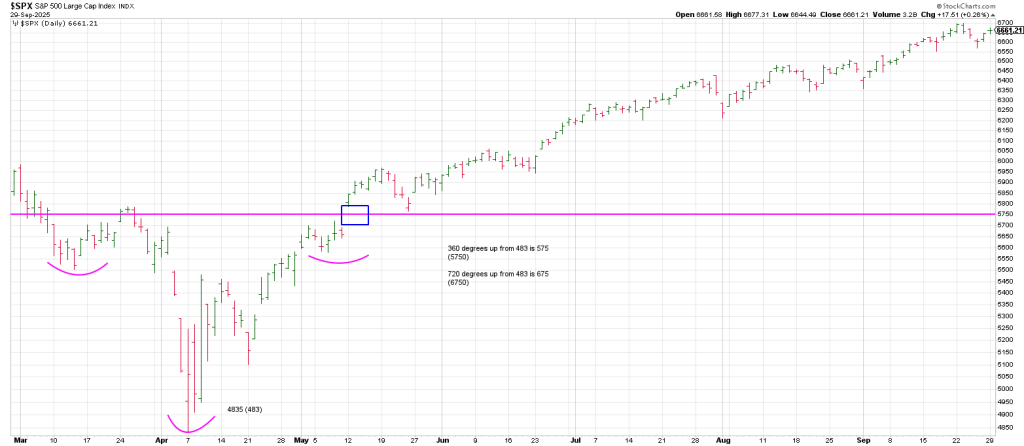
Last week we walked through the potential for a push to 6750 SPX
Based on the geometry of the Square of 9 Wheel.
It showed the synergy from the April low of 4835 to 5750 pointing to logarithmic equality at 6750.
It looks like we could it 6750 this week.
Here is the chart again.
Since the April 7th low, every turn down in the 3 Day Chart has defined a low.
The 3 Day Chart turns down with 3 consecutive lower daily lows (intraday, not closes necessarily).
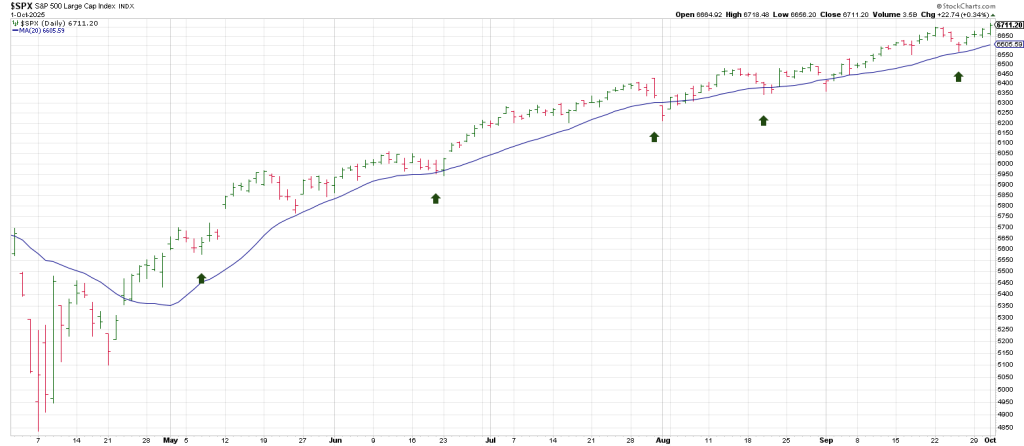
The last turn down on the SPX 3 Day Chart occurred on September 25.
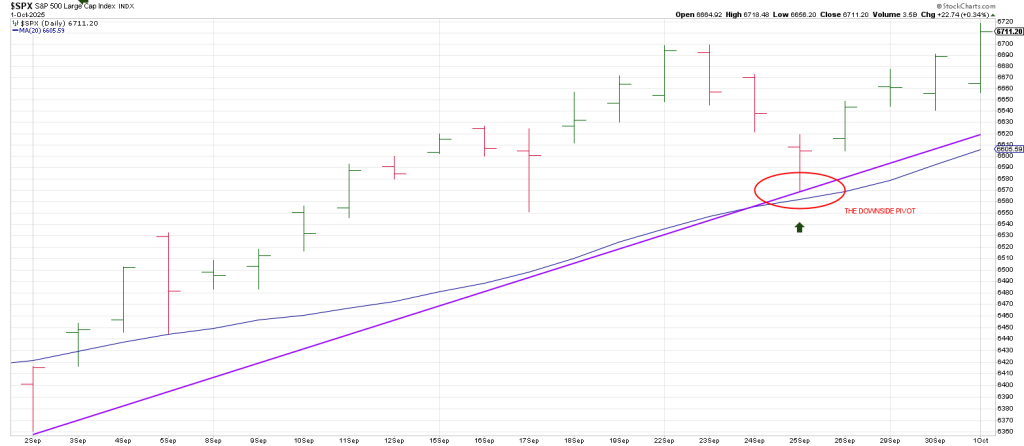
Notice that each turn down of the 3 Day Chart since the April 7 low has coincided with a test/undercut of the 20 day moving average.
A test of the rising 20 DMA is what I call the Holy Grail.
Why is it so powerful?
I don’t know except to say that a month is approximately 20 trading days.
Once again the Combo setup of a turn down in the 3 Day Chart in tandem with a test of the 20 day moving average perpetuated a rally to new highs.
It’s been like a broken record over and over again the last 6 months.
To be precise October next week ties to 180 degrees/days from the big April 7 low.
These ‘natural’ divisions/decrements of the 360 degree cycle first pointed out by WD Gann do a good job of calling turning points and defining the trend.
Earlier this week we noted the significance of early October as a turning point anniversary.
In 1929 when the DJIA broke the October 4th pullback low, the Great Crash started.
In 1987 the last rally pivot high was October 4th.
In 2002 the bear market low was early October.
In 2007 the bull market high was early October.
In sum, there are many reasons (apart from the litany of historic divergences we walked through in yesterday’s report.
I am bearish…but there is a big difference from being intellectually bearish and capitalizing on long setups.
As legendary market operator, Marty Zweig, once said, “You want to make money or you want to be right.”
Youse puts up your money and youse take your chances.
So despite the ugly internals and price action most of Tuesday (until the last hour), Hit and Run took
Some ‘Overnighter’ longs (in addition to other positions).
Both names, AVAV and STX were bought near Tuesday’s close.
Both are in Runaway Moves…Lockout Rallies.
AVAV tailed off on Monday leaving a little signal bar reversal, but Tuesday AVAV closed near session highs virtually offsetting Monday’s high.
Note that Tuesday’s rally played out following a turn down of its Daily Swing Chart.
In other words, it traded below Monday’s low and reversed higher.
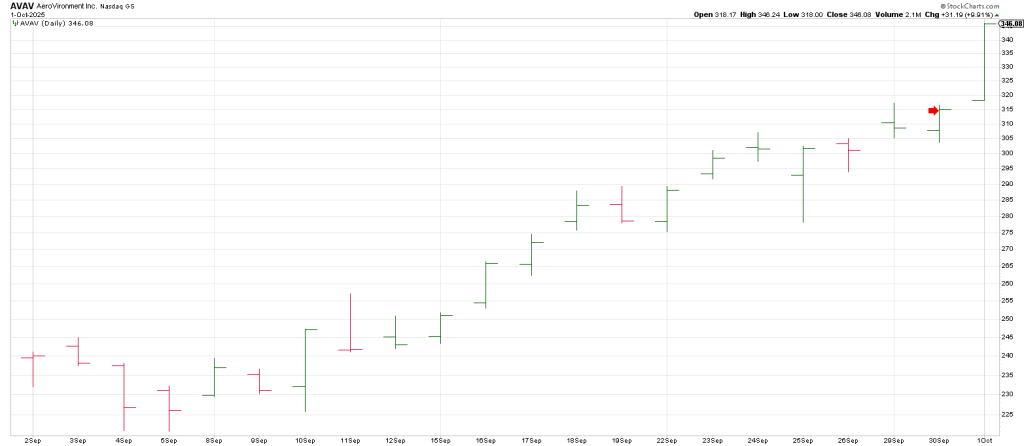
The fuse for an explosive Wednesday was that AVAV would trigger a Reversal of a Reversal on trade above Monday’s Topping Tail.
AVAV was a textbook Overnighter setup.
We didn’t know it was going to explode obviously. The presumption was higher. Period.
Below is AVAV’s 10 minute for Wednesday
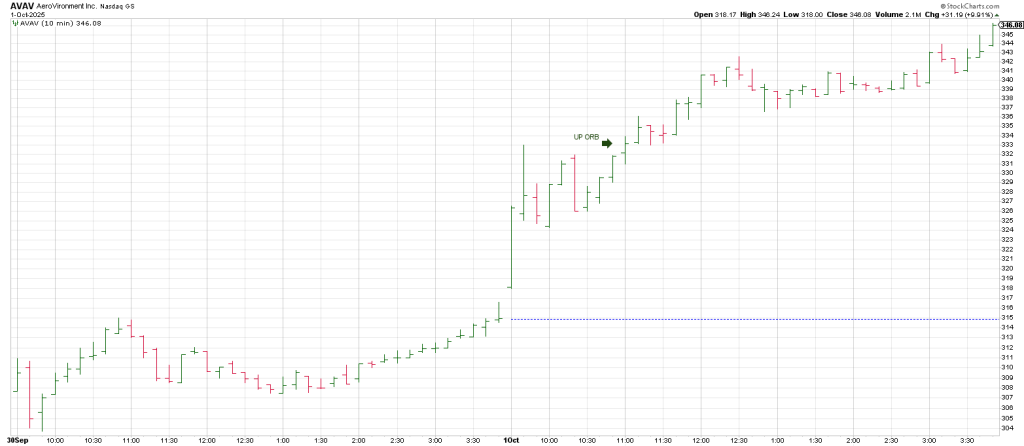
After running up it signaled higher when it triggered an Opening Range Breakout.
This is a move above the first 30 minutes range.
Notice how AVAV produced another push higher after the ORB at 333.01
STX is one of the strongest Runaway moves I’ve ever seen.
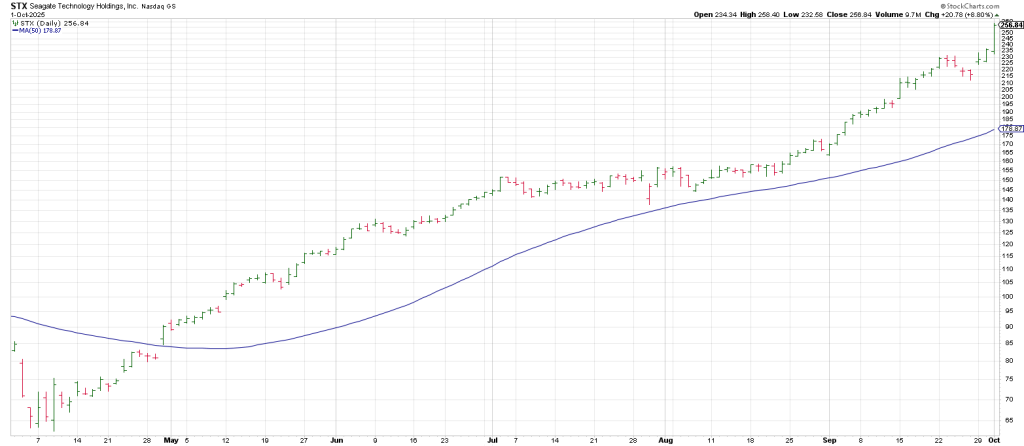
From its April 63.19 low it was trading 236.06 when Hit and Run members took it long just before Tuesday’s close.
What sealed the deal for me for the long Overnighter pick was not just that it closed at a new high, but that the hourlies showed a Cup and Handle pattern.
Multiple Time Frame analysis is one of the secrets to identifying explosive moves before they happen.
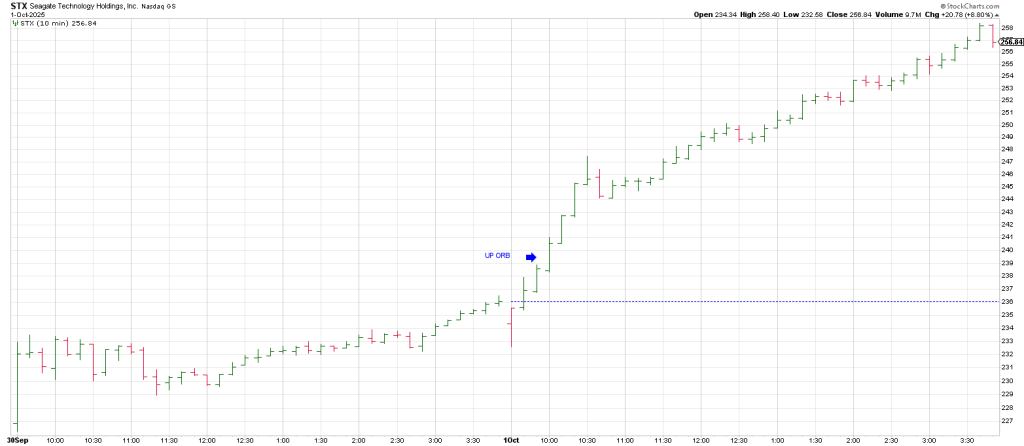
We didn’t have a stop on from Tuesday’s late day entry, choosing to see the price action the first half hour.
If we’d had a stop we would have been stopped out.
That said an up ORB would have called for reentry.
STX produced an up ORB on Wednesday immediately after the first half-hour at238.87.
It ramped to 247 where it looked like it was done for the day.
However, remarkably, a one hour consolidation delivered another powerful leg higher…a perfect Measured Move of the morning leg.
Who says there’s no order in markets?
In sum, the last swing low on the Q’s was 559 on September 2.
180 degrees straight across and opposition on the Square of 9 Wheel is 607.
That said 603 (Wednesday’s high) squares out with the 402/403 April low.

Square of 9 Wheel
Purchase your own Square of 9 Wheel. Shipping to US only. Contact Jeff for shipping outside the US.