“Out of there without a doubt” Out of Time, The Rolling Stones
For the last few months I have outlined many factors that have led to my thinking that a top of major proportions is at hand.
I maintain that belief.
Clearly the market as expressed by the SPX and the NDX (versus the DJIA and IWM) have run further in time and price that I assumed, but as you will recall a few weeks ago we noted our expectation for Buying Climax.
Indeed, in early June we noted that this would end with a bang not a whimper.
I was wrong about the square-outs that pointed to April and May potential final peaks; they only elicited pullbacks. But that’s the thing about square-outs:
Gann said that all important highs and lows are square-outs but he failed to add that not all square-outs are important highs and lows.
Interpreting Time/Price synchronicities is like playing a 3 dimensional chess game: every move creates a different dynamic…but the End Game remains the same.
Again, early April produced a sharp drop.
The Key Reversal Day on May 23rd produced a drop but much shallower.
Players confidence increased after the SPX struck a new high after the May 23rd Key Reversal Day.
This is borne out by the subsequent reactions being smaller and smaller, if any to speak of, since the May 23rd Key Reversal Day was offset.
This is consistent with W. D. Gann’s comment:
“In the last stage of the campaign, reactions get smaller as stocks work to higher level, until the final run has ended.”
This is the picture.
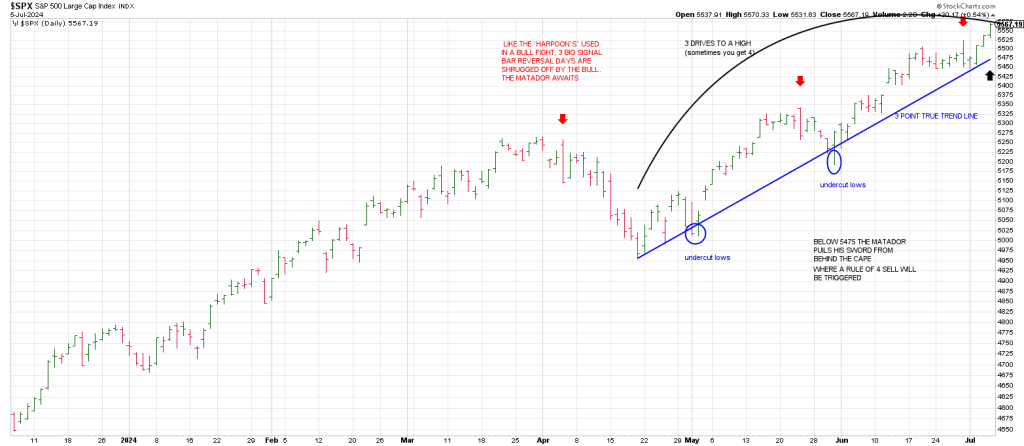
Now with the drive higher following the undercut of a Bottoms Line off the April low and offsetting the May 23rd Key Reversal day the SPX has been in a second Runaway Move—the first being the rally off the April 19 low.
These two Runaway Moves satisfy a Measured Move.
Allow me to explain. The rally from the April 19 low to the May 23high was 389 points.
Adding 389 points to the 5191 May 31 low gives 5580.
Friday the SPX struck a record high of 5570, closing at 5567.
5567 is a very interesting marker.
W D Gann stated 7 is the number of panic…specifically 7 squared.
For example we know that the crashes in 1929 and 1987 started 49 days from high—7 weeks from high.
Ending on the 56th calendar day from high.
This goes for buying and selling panics…this 49-56 day Panic Zone.
4900 is a fractal of this 49 count.
Maybe something, maybe nothing but adding 4900 to the 667 SPX low in March 2009 is 5567.
Exactly where the SPX closed on Friday.
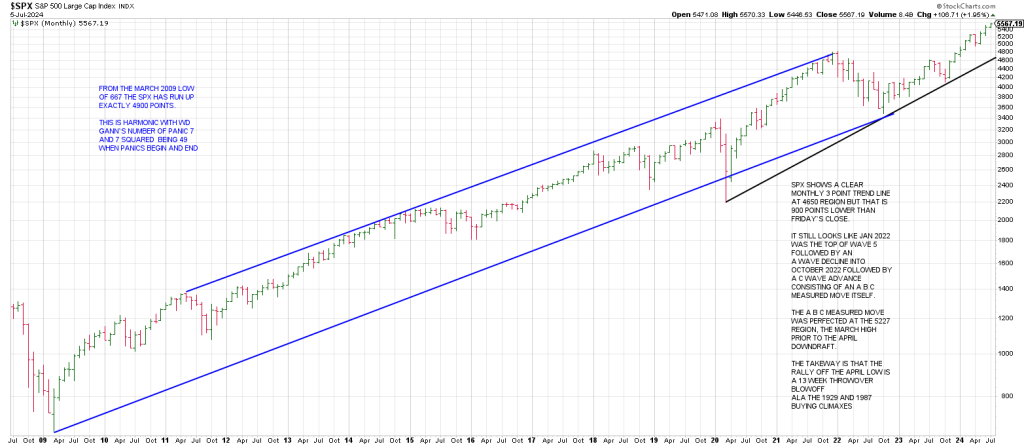
The SPX shows a clear monthly 3 point trend line at the 4650 region. But, that is 900 points lower.
You don’t want to wait for breakage below that to get defensive.
That’s why we’ll be drilling down to the smaller time frames this week to look for a trigger.
The first turn down of the dailies that sees downside follow thru puts us on alert.
The next turn down of the 3 Day Chart that doesn’t inspire a Buy The Dip surge gets our attention.
From my perch it still looks like Jan 2022 was the top of Wave 5 followed by an A Wave decline into Oct 2022. From there a B wave is unfolding consisting of an A B C Measured Move.
The Measured Move was perfected at the 5227 region, the March 2024 high prior to the April downdraft.
Consequently, below the 5227 region is a Get Out Of Dodge signal.
Notably, this is currently solidly below the 50 day moving average.
The 50 DMA was test on May 31st and perpetuated a buying frenzy.
Breakage below the 50 DMA now signifies the bloom is off the frenzy.
Importantly the black Bottoms Line, a 3 point trend line is at 4600 ish.
There is 900 points between here and monthly support.
That opens up the door to a doozy of a first break potentially.
And, since the 2022 bear was a slow motion train wreck (what I believe may be an A Wave down), the Principle of Alternation indicates the next downdraft will be an elevator, not an escalator.
As well, we know that this week is pivotal.
Why?
Speaking of Runaway Moves, the blow-offs into the highs in both 1929 and 1987 were 13 weeks (basically 90 days/degrees)
This week is the 12th week from the mid-April low.
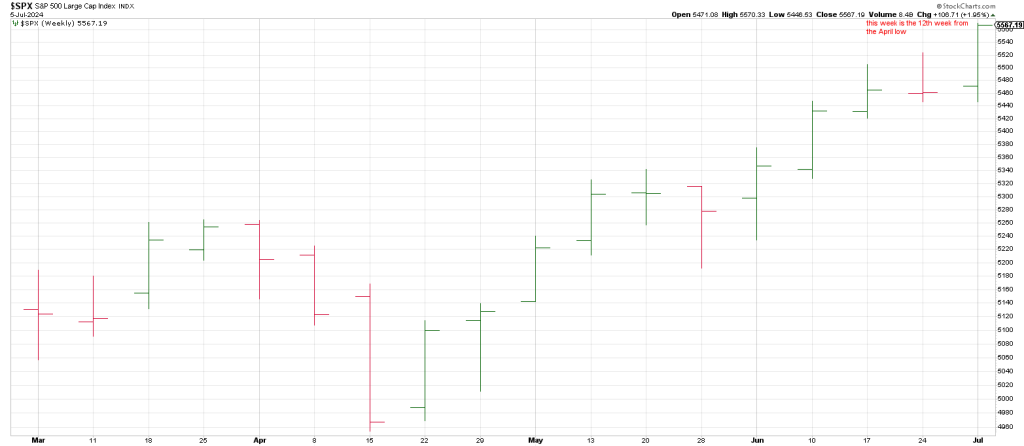
Does that mean it’s clear sailing to July 19th…precisely 90 days/degrees from the April 19th low.
Maybe. But the market is not a Rolex.
Plus or minus 1 is a good rule of thumb.
There always a T Rex in the cycle ointment.
That said we also know that mid-July ties to the Primary Top in 2007 and the top in 1990.
The Primary Top in 2007 saw a sharp break into August and then a false nominal new high on October 11th 2007.
The mid-July high in 1990 was followed by “two weeks on the side” followed by a crash into October.
So cycles are due to exert their downside influence here in July.
From July 1990 to July 2007 is 17 years.
From July 2007 to July 2024 is 17 years.
As well we have a couple of powerful Time/Price square-outs.
1) The SPY low at the big October 22nd low was 348. (blue)
Opposite 248 is 559 (red) which ties to the aforesaid 5557/5580 region
Both of these prices align with/point to July 19th (yellow)
Interestingly they form a T-Square to October 19th, Black Monday in 1987 (green)
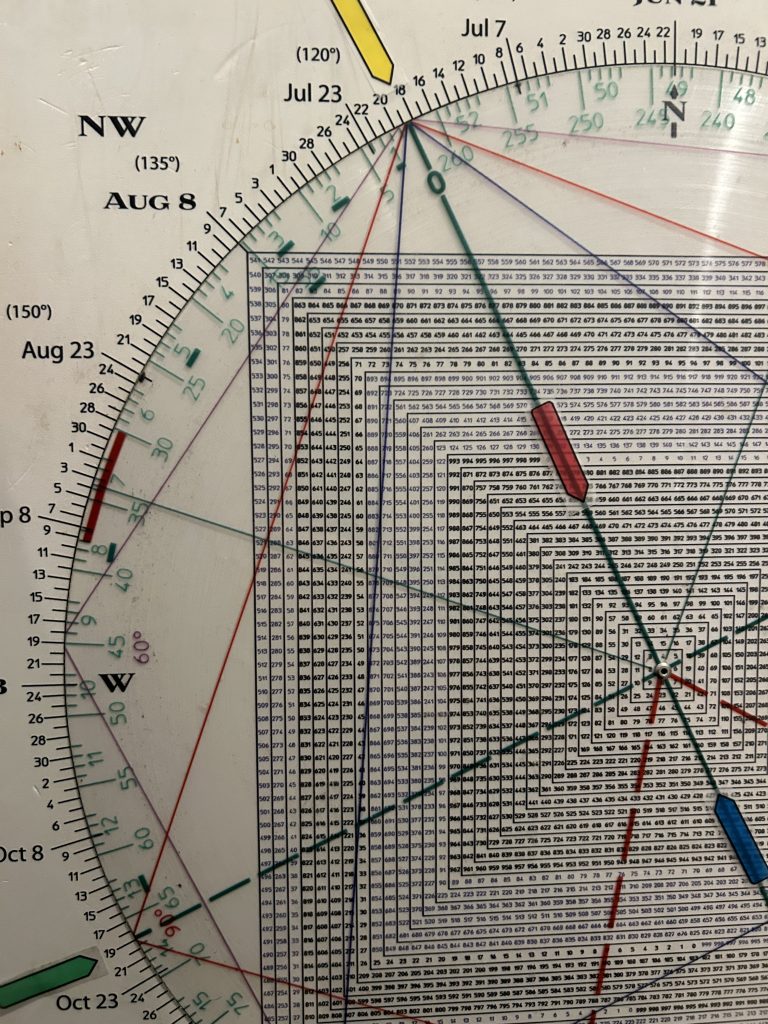
2) Today is a big anniversary. It is the 92nd anniversary of the Great Depression low on July 8th 1932. Several months ago we wrote about the idea of a mirror image fold back from that period 90 years ago. Is it possible this July sees a major high opposite the major low in 1932?
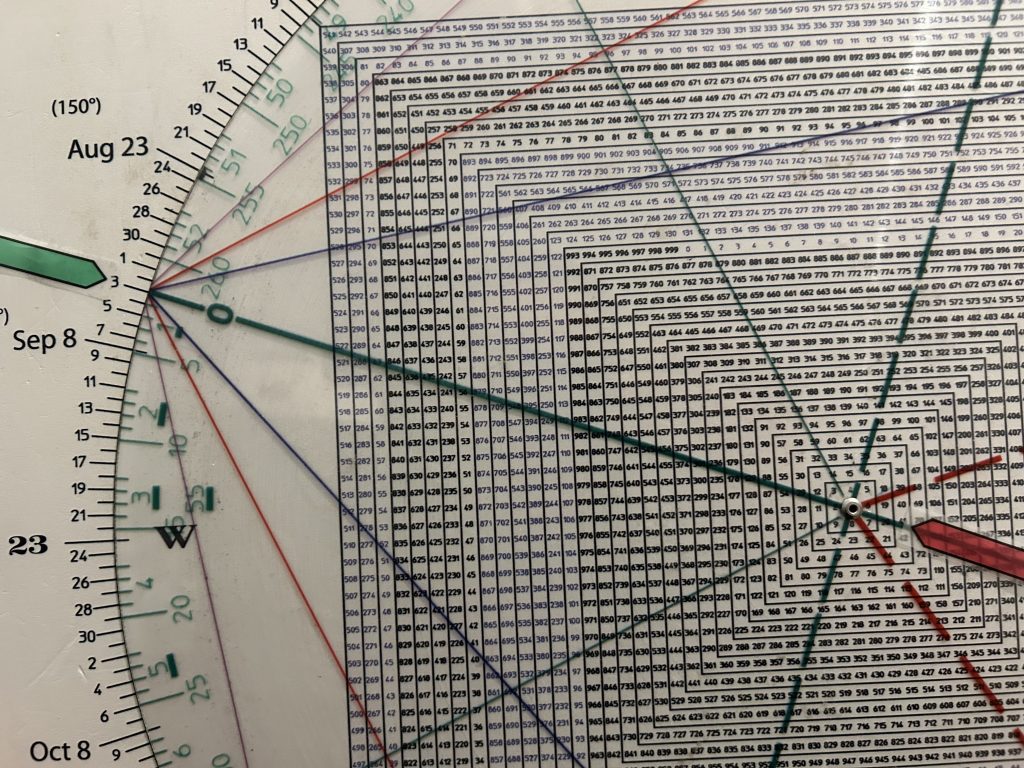
On the Square of 9 below, I anchored ‘zero’ to 92 (blue) as 1932 is 92 years ago.
Notice that 92 aligns with July 30 (yellow) which ‘times’ a possible 2 weeks on the side from a possible pivot this week.
This same 92/July 30 ‘vector’ aligns with 556 (red) or 5560 where we are currently.
Notice that this same vector squares-out with October 29th, the Big Kahuna in 1929 (green)
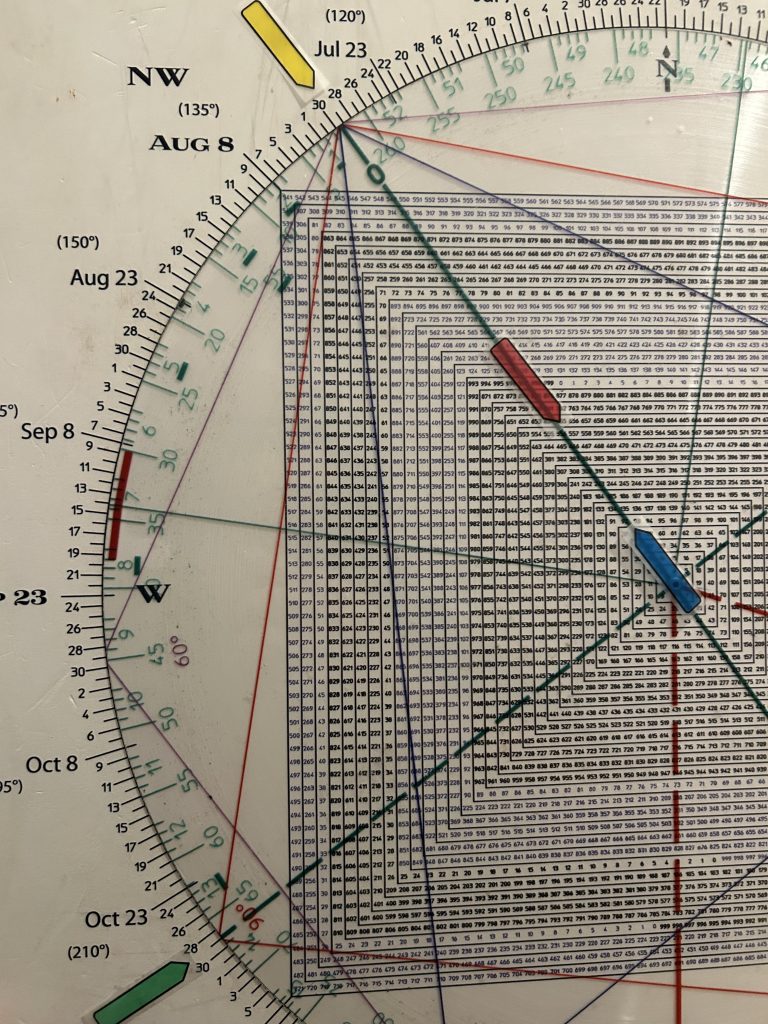
So on both of these Time/Price synchronicity clocks we see a vibration off the 1987 crash and the 1929 crash.
Voodoo?
Consider for a moment that September 3rd, 1929, the pre-crash peak, points to 41, the DJIA low on July 8, 1932.
Given the above time and price harmonics, I would not be surprised to see an Air Pocket soon with a possible retrace into the end of the month before a gorilla rings the doorbell.
Mr. Market is on borrowed time
Gold
Last week we showed a chart with a 14 month and 28 month cycle.
Below is a tangential 7 month cycle going back to the major low in December 2015.
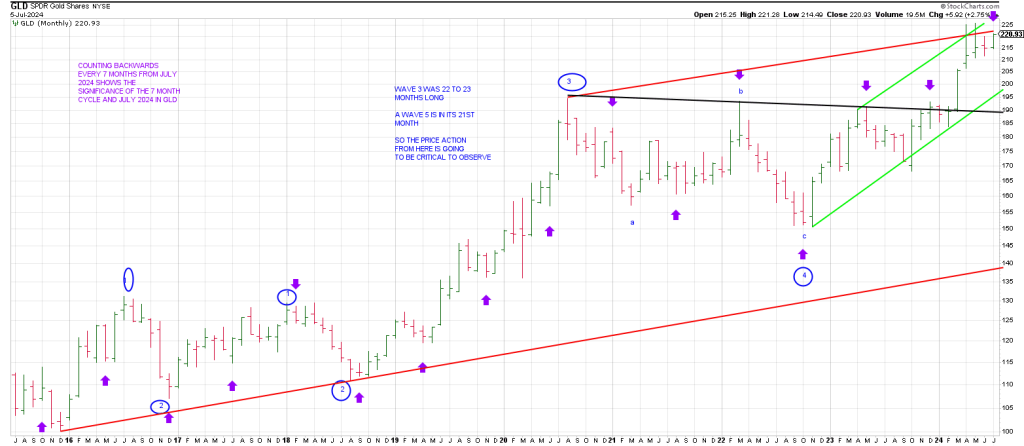
I’m counting backwards 7 months from July 2024.
You can also see that we are in a 5th wave of some degree. We have to be mindful of a triple top this summer for a consolidation.
The alternate scenario is an acceleration point but I think there is a likelihood GLD carves out a triple top prior to a pullback. If so when GLD ‘comes out’ it will be explosive.
Notice the top rail of the red channel. GLD has never closed above this level.
It would not surprise me to see GLD spike to the top rail of the smaller green trend channel to new all time highs before a consolidation unfolds…if it is going to.
Above the top of the green channel and holding is blue sky for gold.