“Some call it magic, the search for the grail.” Mind Games, John Lennon
Markets spent the day in a holding pattern until the last hour when quarter-end window dressing had to make an appearance…government shut down or not.
Breadth remained negative, reflecting the underlying weakness beneath the surface.
Despite negative breadth, the DJIA rose by 81 points, the SPX by 27 points and the NAZ by 67 points.
The attention then shifted to overnight action where the futes immediately retreated after the surge into the bell.
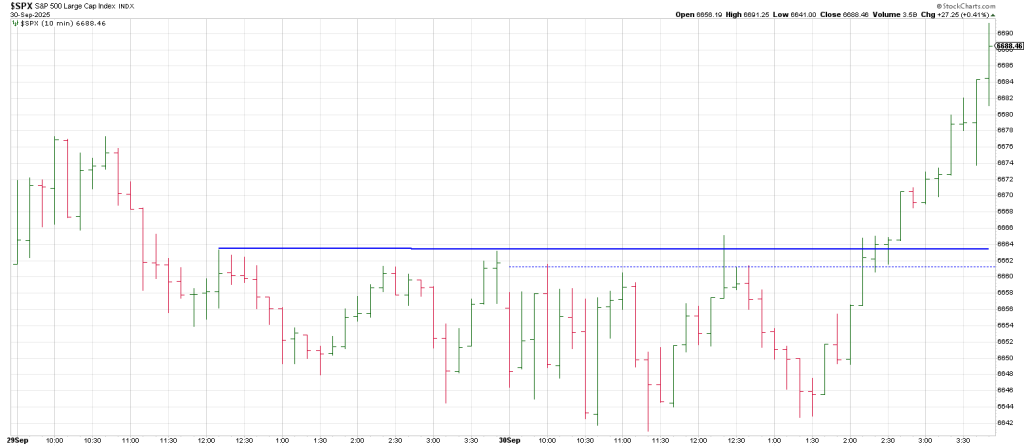
At the end of the day, literally, the SPX produced an outside up day.
Breakage below Tuesday’s low today triggers a Keyser Soze sell signal…a Reversal of a Reversal.
Given it’s a new quarter and its October, pent-up selling may lead to a doozy of a downdraft:
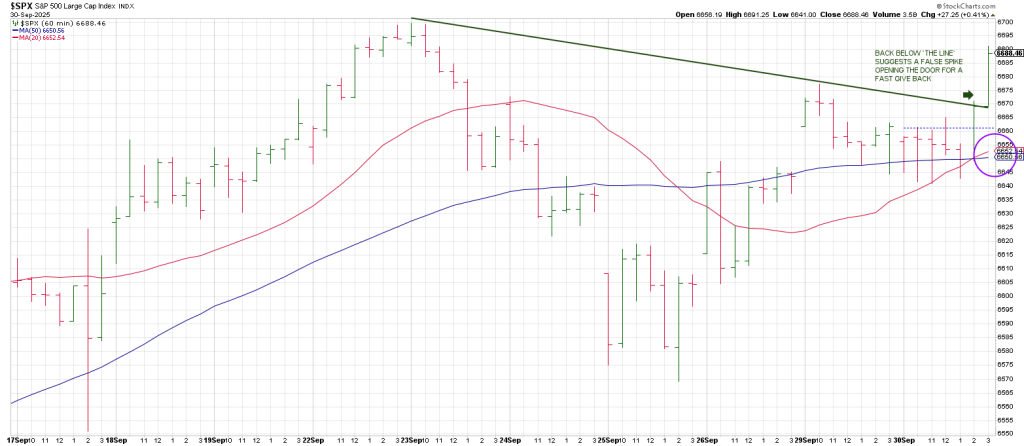
False moves lead to fast moves…the false move being the late rally and outside up day theoretically.
The SPX reached an all-time high on September 22 and left bearish Train Tracks on September 23 but the underlying message from market internals is that this rally is living on borrowed time.
Beneath the surface, multiple indicators have failed to confirm the SPX’s advance, creating the kind of divergence that has historically marked the transition from bull markets to bear markets.
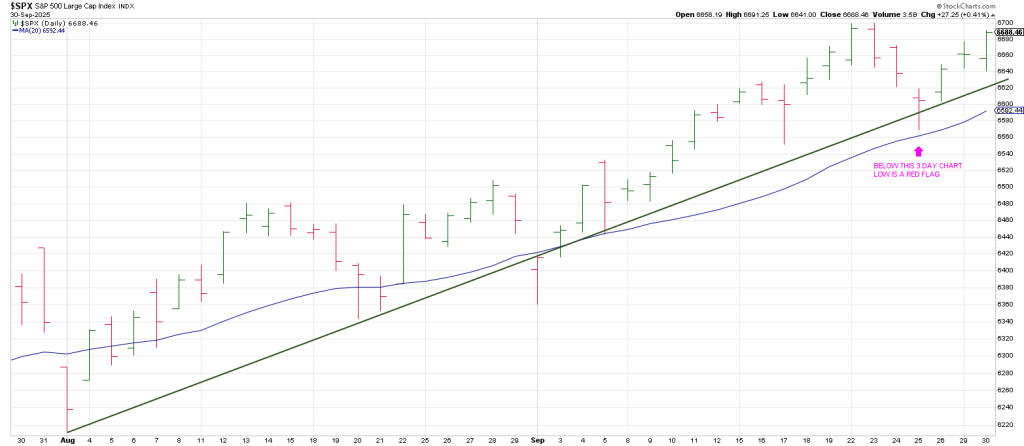
The 3 Day Chart circled low at 6559 on September 25 is the critical point to watch.
Breakage is a change in character from the entire rally from April.
Perhaps the most important warning comes from the bond market.
The 10-year Treasury yield has reversed its trend and is now rising, confirmed by a weekly key reversal pattern,
Historically, such reversals in yields have been closely associated with the end of equity bull markets.
As borrowing costs move higher, the liquidity that has underpinned stock valuations begins to dry up—a critical shift at this late stage of the cycle.
At the same time, the SPX’s new high has not been validated by critical measures of breadth and participation:
- Transportation Average (Dow Theory): The transports have lagged significantly, a classic non-confirmation under Dow Theory. Without strength in economically sensitive transport stocks, headline gains in the SPX lose credibility…at some point.
- McClellan Oscillator: Instead of confirming, the oscillator has slipped below zero. This divergence suggests that momentum is faltering, even as the index continues to make new highs.
- NYSE Up Volume minus Down Volume: The net volume has turned negative, indicating that more shares are trading at lower prices than at higher prices. This reflects distribution beneath the surface.
- NAZ Up Volume minus Down Volume: the same negative trend appears on the NAZ, underscoring that selling pressure is broad-based.
- Percentage of NYSE issues above 50 day moving average: the broader market picture is equally weak, with the NYSE showing a majority of stocks trading below their 50 DMAs.
- NYSE New Highs Minus New Lows: At a time when the SPX is printing new highs, the net count of new 12 month highs versus lows is failing to confirm—a blaring siren.
Taken together these divergences show a market advancing in name only, supported by a narrowing group of large-cap names while the majority of stocks weaken. Historically, such conditions have preceded significant tops.
With bond yields reversing higher and breath deteriorating across multiple dimensions, the evidence strongly suggests that this rally has neared exhaustion.
What remains after these metrics is Time and Price which is why we pay so much attention to cycles and the Square of 9 Wheel…because divergences can last for a while as we all know.