Wednesday’s report was titled “Was This An Historic Turnaround Tuesday?”
For the third consecutive morning, the market gapped up on the open only to quickly relinquish the gains.
It looks like someone wants to created a bid to exit.
The third time turned out to be a charm…for the Bear.
This weeks technical deterioration in the QQQ didn’t just happen overnight.
It took months to produce.
The Q’s struck an all-time high on the October 29th “anniversary”.
90 days/degrees later they scored their Secondary High, confirmed by the angle of attack to the downside since that January 28th signal bar reversal…a Gilligan sell bar.
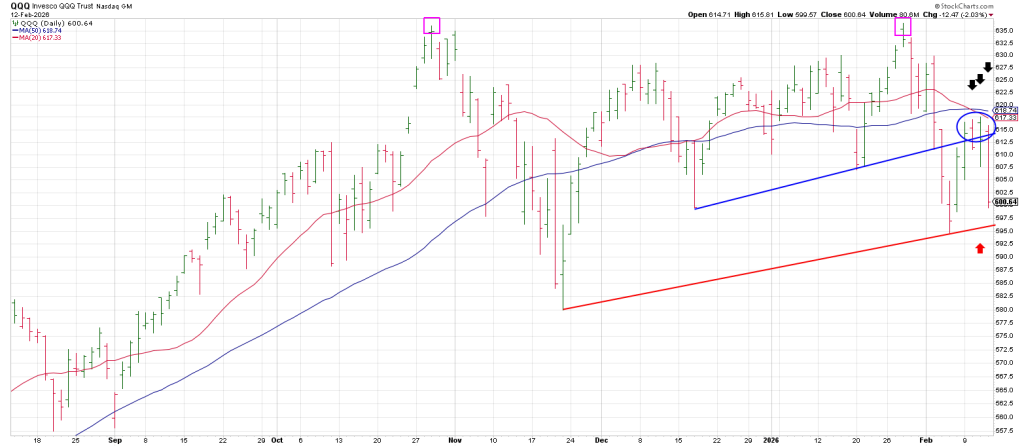
Thursday’s knife lower followed several backtests earlier this week of the QQQ 20/50 Bowtie with both averages having rolled over.
The Q’s broke a Bottoms line connecting the December low and the January low in early January and checked back or backtested this Bottoms Line early this week, rolling over with authority yesterday.
A larger Bottoms line connecting the November and early February lows is just a tad below current levels at 596 today.
The QQQ 3 Day Chart turned down at the February 5 low producing a bounce which turned the 3 Day Chart back up on Tuesday, Feb10.
If a market is bearish a turn up of the 3 Day Chart will define a high soon, in terms of time and price.
That’s exactly what we got. The subsequent price action has been dramatically lower.
Now the Q’s are threatening to violate the ‘circled’ 3 Day Chart low—that’s the low on February 5th at 594.76.
Trade below 594.76 by even one tick will produce a Time Turn Trend signal.
This is on the daily basis. When it occurs on the weekly it is a major signal.
So where does that “TTT” occur on the weeklies?
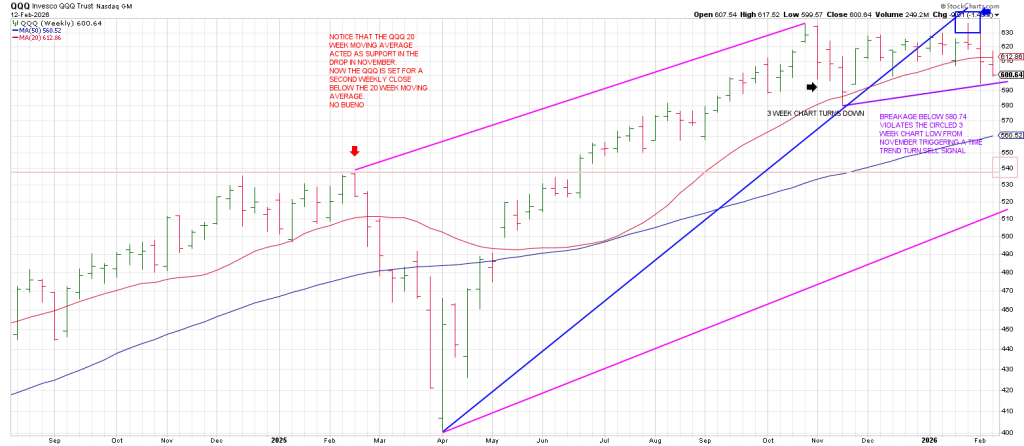
The QQQ 3 Week Chart turned down right off the October 29 high.
The week of November 17 saw the Q’s satisfy 3 consecutive lower weekly lows.
This is how the 3 Week Chart turns down.
Stunningly, the 3 Week Chart never turned back up since that November low.
The QQQ never traced out 3 consecutive weekly higher highs to this day.
In other words the 3 Week Chart has remained pointing down since mid-November.
That puts mid-February, where we are now, on the map as it is 90 days/degrees from the November low…specifically February 20/21.
The “circled” 3 Week Chart low is the low is 580.74, the low from the week of November 17.
Trade below 580.74 will trigger a Time Trend Turn signal on the WEEKLY basis.
This is confirmation that a major high is behind us===albeit it would not be surprising if we get a Knee-Jerk reaction to the upside once the circled 3 Week Chart is broken.
Notice that the QQQ 20 week moving average acted as support in the drop in November.
Now the Q’s are set for a second weekly close below the 20 week moving average.
No Bueno.
Where are the Q’s headed?
The Oct 29th high is 637.
90 degrees down = 612.
180 degrees down is 588.
270 degrees down is 564.
360 degrees down is 540.
If 540 sounds familiar, it should.
540.81 was the high in mid-February, one year ago.
Said another way, once the 540 region was reclaimed in June, the presumption was it would rally 360 degrees from high to high.
That’s exactly what it did. The Q’s rallied 360 degrees from 540 to the precise high in October 2025 of 637.
Got geometry?
You think the market is random?
The market is ordered, deterministic.
I don’t know how anyone manages risk without knowing how to truly measure risk.
This is the benefit of the amazing Square of 9 Time/Price Calculator pictured below.
You can grab a free ebook at cooperhitandruntrading.com

Square of 9 Wheel
Purchase your own Square of 9 Wheel. Shipping to US only. Contact Jeff for shipping outside the US.
How does Time align with these prices?
We noted that 90 days/degrees in time from Oct 29 ties to the late January Secondary High.
Another 90 days/degrees from late January points to late April 2026.
Interestingly, late April aligns with 560 which ties to 270 degrees down on QQQ and represents a material breach of the 200 day moving average currently at 580.
With 180 degrees down being 588, the “pull” should produce a minimum drop to a test/undercut of the 200 dma.
The 200 day moving average has not been tested since it was recaptured on a massive gap in early May 2025.
It’s due to be tested.
Breakage below the 200 day moving average opens the door to a test of the February 2025 high at 540…with prior resistance being new support.
In sum, the magnetism of the 588 and 540 levels are going to exercise their geometric influence.
This weekend I am working on a report for Tuesday showcasing why a major top has unfolded with the SPX headed to 6100 to 5750.