“And we won’t stop ‘til we’re done.” Back In the High Life Again, Stevie Winwood“The basic speculative impulse, which is to believe whatever best serves the good fortune you are experiencing.” John Kenneth Galbraith
“Bear markets are born on euphoria, grown on grinding economics, mature on recession and die on panic.” Ken Fisher
The surface narrative is stocks had a big rebound after the CPI inflation report sparked anticipation of a rate cut from the Fed and stocks blasted higher on the news.
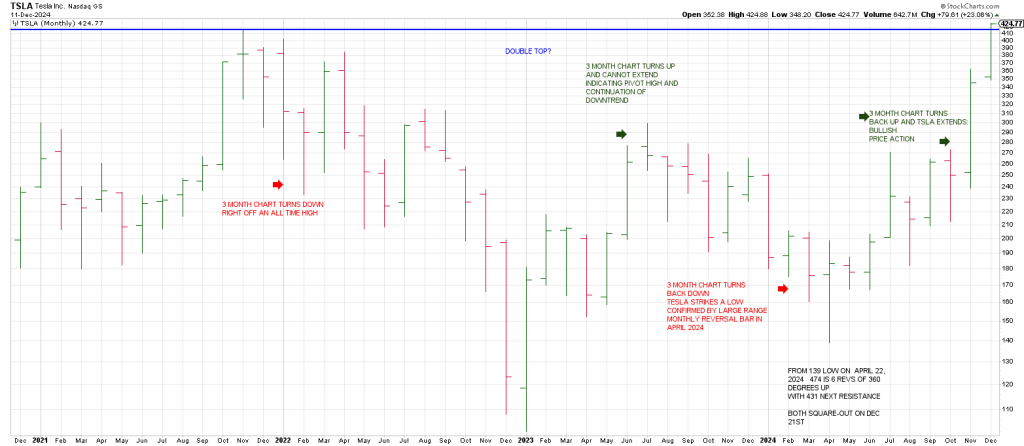
Yes the NAZ struck a record high capitalizing on a Plus One/Minus Two pullback buy setup.
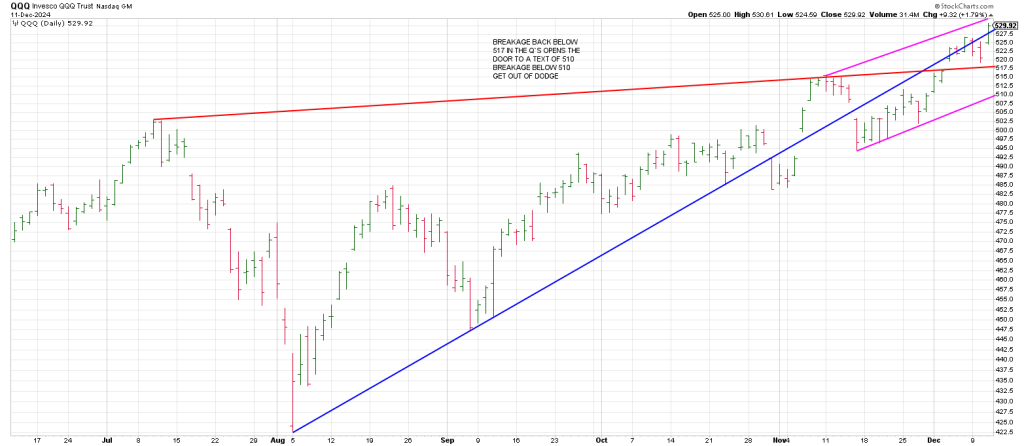
Yes the Q’s struck a record high from the same setup.
However, while the SPX rallied sharply up 49 points, the index did not make a new high.
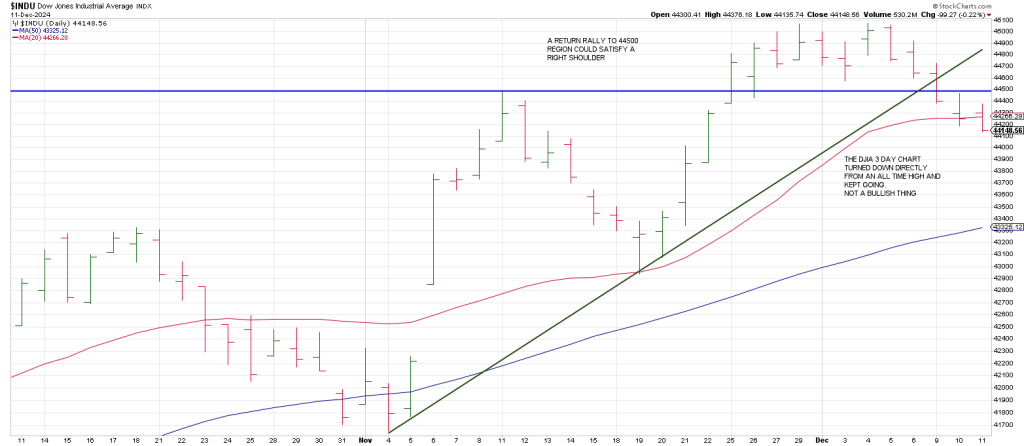
The DJIA was down 99 points.
IWM was lackluster…trending down since its November 25th signal bar reversal day to test its 20 day moving average on Tuesday.
Wednesday’s action in IWM following that test was less than inspiring.
As well Wednesday’s rally occurred against the backdrop of sharply rising 10 year yields.
On Friday TLT gapped up and closed below the open setting the stage for yesterday’s turn down
In the 3 Day Chart.
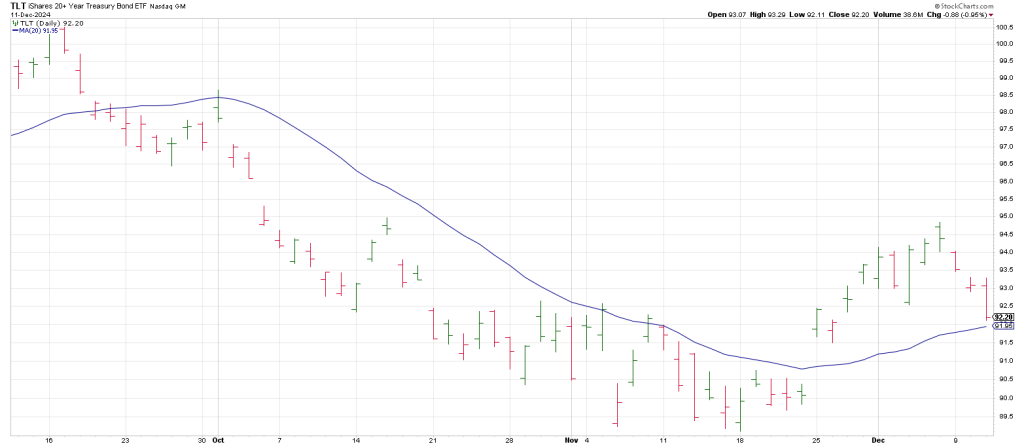
TLT is perched on its 20 day moving average.
Downside follow thru after Wednesday’s turndown in the 3 Day Chart opens the door lower…likely to at least the open gap at 90.50 region.
So the narrative is stocks knee-jerked up on the CPI because it will pave the way for a rate cut this month?
You mean stocks rebounded because of a rate cut like September when the Fed cut rates for the first time since 2020 and 10 year yields went from 3.60 to 4.50?
Got any bridges for sale?
So the new NAZ/QQQ highs occur while TNX rallies, USO (oil) breaks out), gold rips and the DJIA slips 99 points.
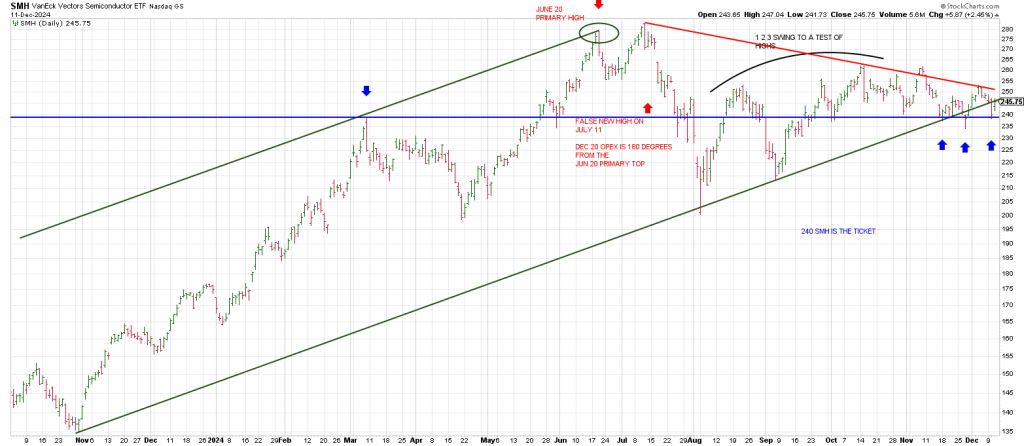
And SMH (the semis) hasn’t made a new high for two months and remains waterlogged below its 50 day line.
Got any bridges for sale?
Be that as it may the DJIA closed below its 20 day moving average courtesy of the excitement.
It also closed below its November 11th peak.
That’s never a good thing technically when a prior swing high is lost—assuming it’s not an undercut and we see downside follow thru.
As well the SPX tested our 6090 upside pivot again.
609 (6090) is 3 price cycles of 360 degrees up from the major 349 (3490) October 2022 low.
Maybe something, maybe nothing but the 249, 609 axis points to January 11th, the false breakout bull market top in 1973.
A 50% decline ensued.
In sum, while markets started with a surge, internal exhaustion quickly took over.
While breadth started at 1300/1100 net advances on the NYSE /NAZ, it promptly gave back those gains, briefly going to net declines around noon. Markets rallied again in the afternoon, only to meet the same fate as in the morning.
By the end of the day, net advances were just 159/206 on the two exchanges.
The Mag 7 masked the exhaustion below the surface.
While it looks like “the market” is back in the high life, the internals indicate positive momentum has been expected and even “good news” cannot overcome rapidly falling internal momentum.
November’s PPI (Producer Price Index) is scheduled for 8:30 a.m. today, and barring any big surprises from that report, next Friday’s last monthly OpEx will start to exert its push and pull.
At the dot.com market top in 2000 and again at the market top in 2007 that preceded the GFC, the DJIA peaked first and the NAZ, the more speculative index, topped later, The market may be setting up the same sequence now.
The SPX advance/decline ratio has been negative every day this month…Santa’s stealth sleigh ride in reverse. Yet the index has managed to eke out a gain for the month so far.
The situation is unprecedented according to Bloomberg: “the current episode marks the 11th time there has been a negative breadth steak of 7 days, and it’s the only one that has seen the SPX rally over that period.”
The narrowness of the stock market’s advance is not a healthy sign.
Monday we tweeted that 90 degrees down is 6022. The SPX dropped to 6029.
Close enough.
Monday night I did the following 10 min SPX which looked impulsive to the downside.
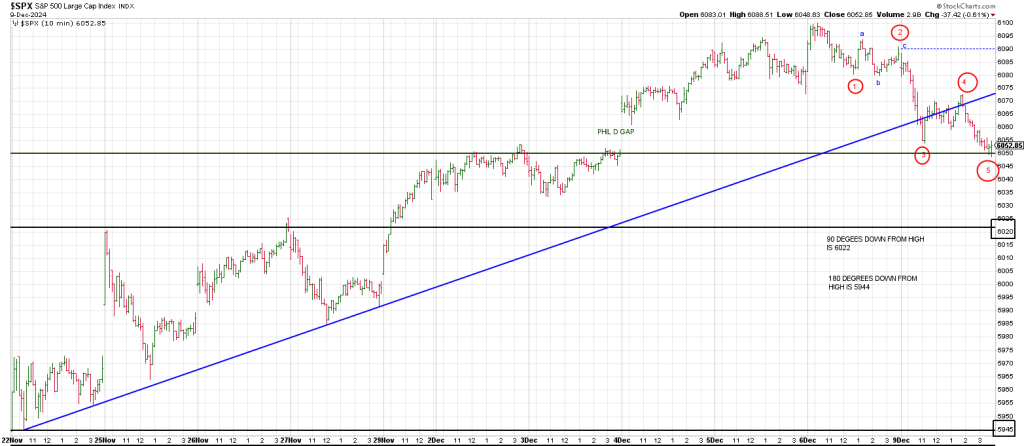
The implication is Wednesday’s rally is likely corrective in nature, a larger degree wave 2 rebound.
That said, the index did reclaim the broken blue short-term trend line.
However, notice that the SPX rallied back to the wave 2 high on Wednesday.
Bottom line: breakage back below the blue trend line, the 6070 region, opens the door lower.
Breakage below Tuesday’s low opens the door to 5944.
A drop below a 5 wave impulsive decline following a countertrend rally puts the ball in the bear’s court…at least in the short term.
As well you can see the lateral support at 6020. Failure below 6020 is a point of recognition.
The bulls will be looking to sell bridges along with narratives should that play out in short order.
Chart Reading