“We use our eyes all the time, but often we really don’t see what is in front of us.” Michael Zakian, Pepperdine University
“Sky pilot, how high can you fly
You’ll never, never never reach the sky.” Sky Pilot, Eric Burdon
“Markets are roaring. The Hand pulled it off and ran the US dollar higher on an oversized rate cut.
I’ve never seen that before.
If that can happen, anything can happen.”
The above is from the September 19th Hit and Run Report, Buying Panic Blow Off?
We continued in that report showing an logarithmic chart using the 910 point range from the October 2007 top to the March 2009 bottom.
We stated, “As you can see clearing this 5660 level and holding is a big deal that leads to a Buying Climax Throw Over.”
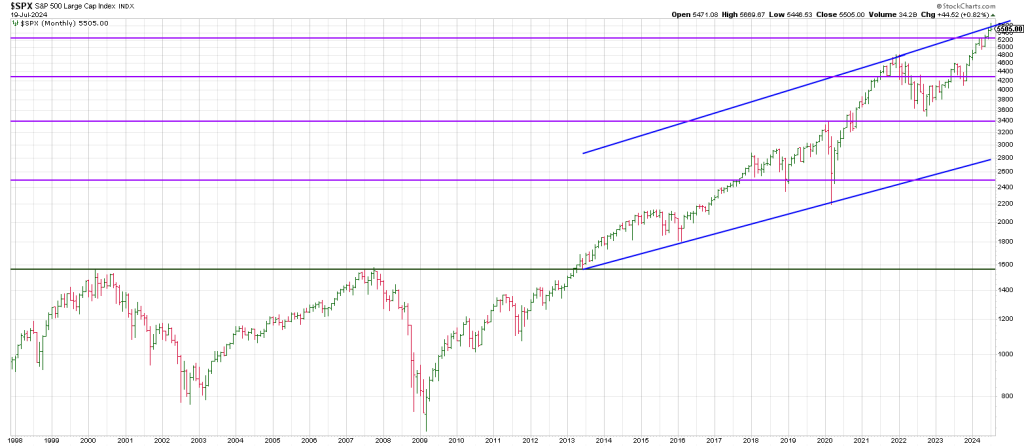
The blue trend line connects the major breakout in 2013 to the 2016 low and the 2020 low.
This is a key trend line because the 2013 breakout took out the 2000-2007 double top.
It was a sideways decade…until 2013.
Paralleling a trend line off the important January 2022 top coincides with the 5500 region.
Consequently, in the second half of 2024 the SPX has blown through horizontal resistance and angular resistance (the trend channel).
This underscores the blow-off in progress.
Both lines will be important on the downside of the Matterhorn.
Notice the intersection of lines near the Covid Crash low and the 2018 Christmas Crash.
Is there a third doozy of a crash around the corner that drops to the 2600 region?
We continued in that same report with an arithmetic chart of the same 910 point range.
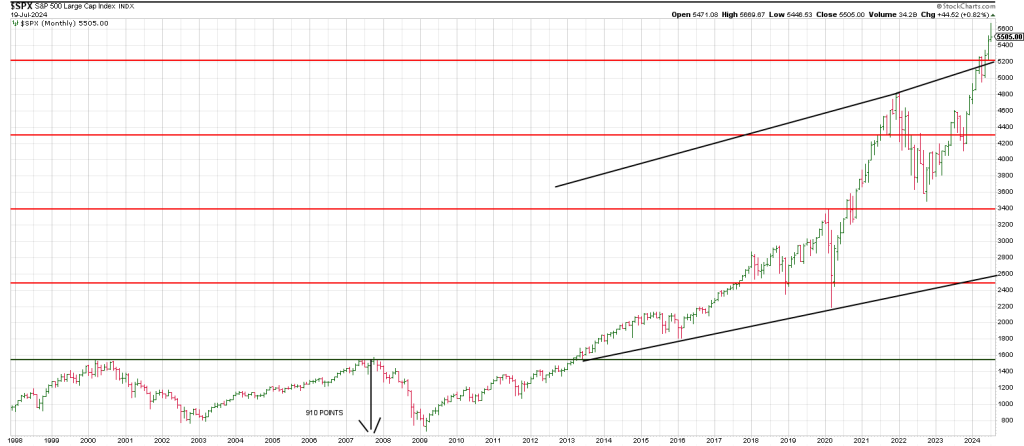
We stated, “you can see how the SPX ripped higher clearing 5200.
Another 910 points higher projects to 6100.”
The drive over 5200 coincided with a breakout of the horizontal price rungs as well as a breakout over the trend channel.
It is not surprising to see the market going asymptotic.
On September 23rd in Turning Point, we showed a monthly SPX below.
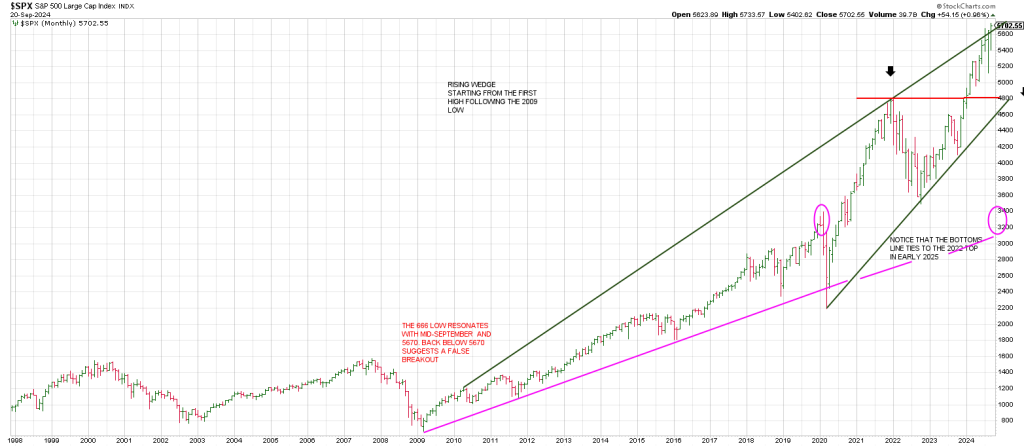
“I connected the first high following the 2009 low to the 2022 peak.
This summer satisfied a third hit of the trend line.
I connected the 2020 low with the 2022 low which nailed the 2023 low producing a Rising Wedge.
One could argue that a Super Cycle top is on the table that a super throw-over could play out to 6100 ish.”
The third hit of this 15 year Tops Line was respected: we got a Flash Crash in early August 2024.
Can the market go vertical from here or does a Throw-Over in The Cycle guarantee a relatively short-lived event and a reversal back below The Line?
The market guarantees nothing. It can do anything. We look for the odds based on past patterns and cycles. A weight of evidence, a cluster, stacks the odds in our favor, but does still does not guaranteed an outcome. Therefore discipline over risk.
Clearly one could argue that the market has already gone vertical.
But the bigger the cycle the bigger the top, the more vertical we could see theoretically.
One thing we can state: there is a strong likelihood that a reversal back through this Tops Line will see a wicked reversion to the mean.
It is likely to be the Bear’s Calling Card.
Notice that the line ties to our Twin Peaks…the summer peaks at 5650-5670.
I initially created the above big picture charts in July but the idea of a spike to 6100 seemed ludicrous after the August Air Pocket.
In markets we all learn to never say never.
In the October 3rd Hit and Run report, with the SPX hitting a pullback low of 5674 and closing at 5709 we stated, “ A new leg up would project to 5860 around October 11, a key anniversary period.
CLEARING 5860 POTENTIALL OPENS THE DOOR TO 6000-6100.”
On the next trading day after October 11, on Oct 14th, the SPX struck a high of 5871 before pulling back 170 points until last Thursday, Oct 31st.
In sum, the SPX left a Breakaway Gap on Halloween.
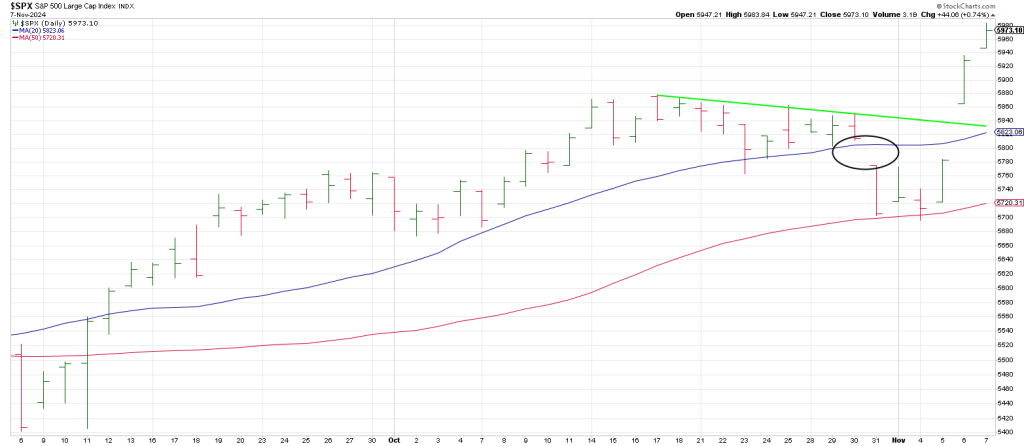
However, the 50 day moving average was tested three times and held.
In Monday’s report, The Art Of Forecasting, we wrote, “If Phil D Gap (the open gap above) is recaptured it opens the door to 6100 ish. Quickly.”
The overhead gap was offset on Wednesday with a massive gap on Wednesday triggering a Jump the Creek buy signal. This was in tandem with a massive move reclaiming the 20 day moving average as well as a Rule of 4 Breakout…a breakout over triple tops.
It speaks to the potential for a heat seeking missile to the 6100 region.
The bull market started from a low on March 6, 2009 which was a square-out at 666.
Interestingly March 6th squares-out with 616 (6160).
Maybe something, maybe nothing but 616 squares early September, the high in 1929.
The Halloween gap down pulled back the rubber band for this blast.
I’m sure it’s just coincidental. But the shake-out produced “blue sky”—ease of movement higher on Wednesday’s the turn of the screw …or is it screw of the turn?