“Yes, I told you that the light goes up and down
Don’t you notice how the wheel goes ‘round?” Badge, Cream
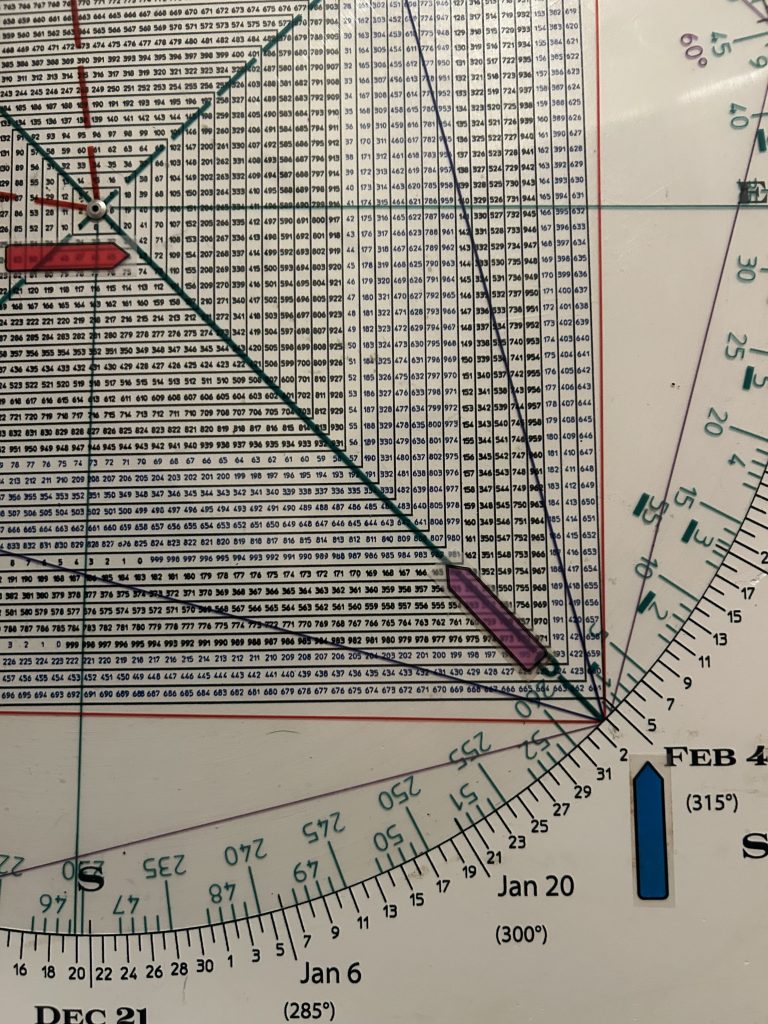
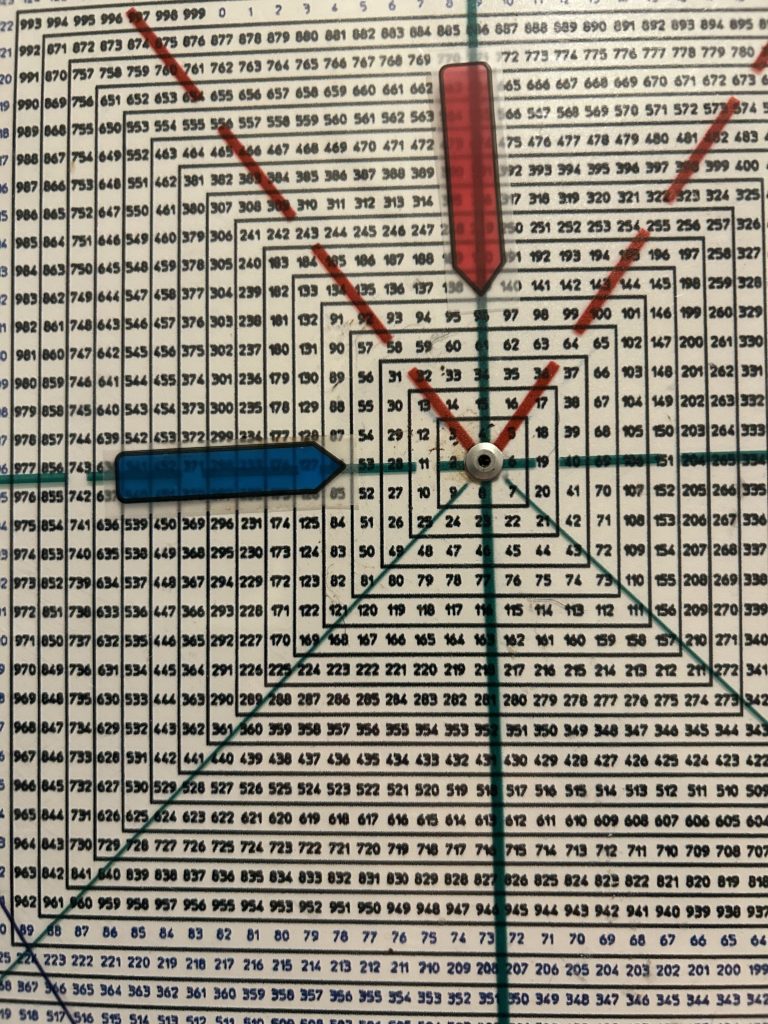
Monday’s report mentioned we would look at what 2026 looks like through the lens of the Square of 9 Wheel.
1) 2026 squares February 3
This ties closely to 90 days/degrees from the October 29 high.
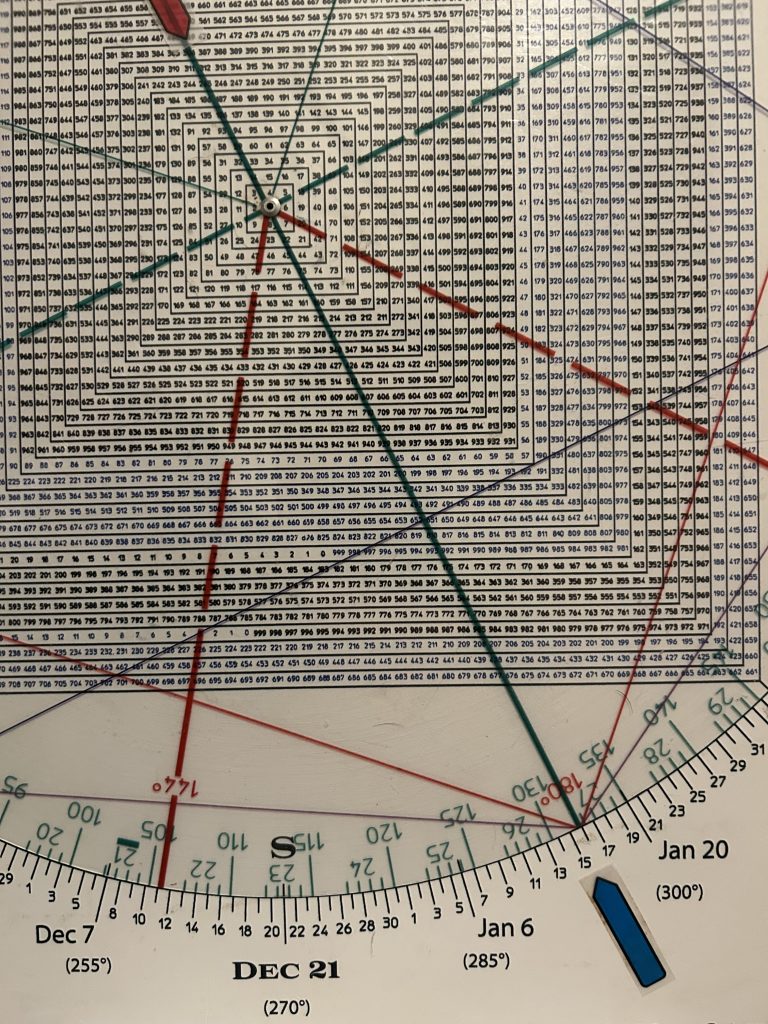
2) February 20. Saturn-Neptune conjunction at Gann’s Zero Point, 0 degrees Aries. Aries is the first sign of the Zodiac and Gann called this the “Zero Point”, the thinking being if you know where “zero” is you can measure anything.
The Saturn-Neptune conjunction will occur at the World Axis and starts a 36 year cycle.
It is considered one of the most important alignments of the century.
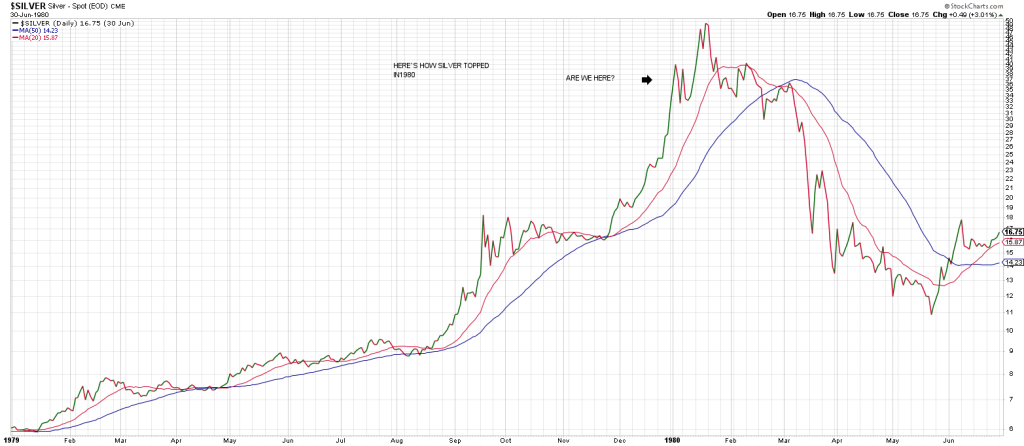
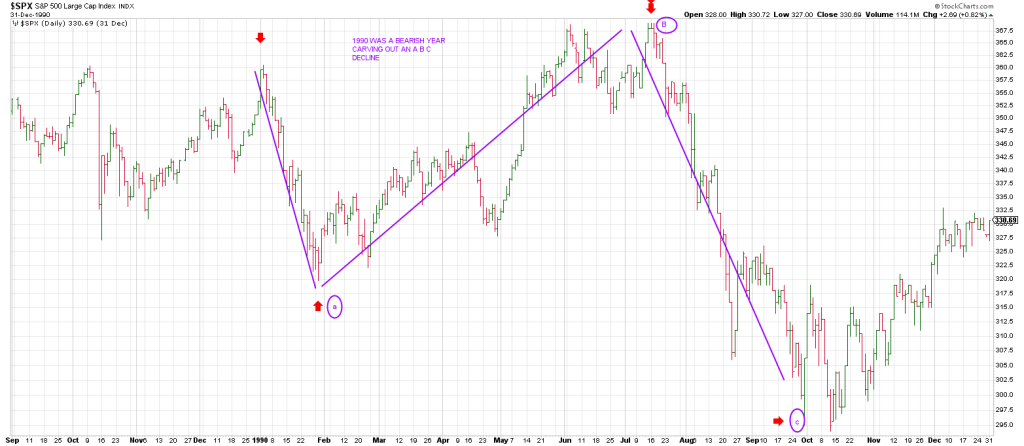
36 years ago was 1990. It was a bearish year.The SPX carved out a large A B C correction throughout the year. It struck a high in January 1990 and dropped 11% that month. It made a nominal new high in June and rolled over dropping 20%.
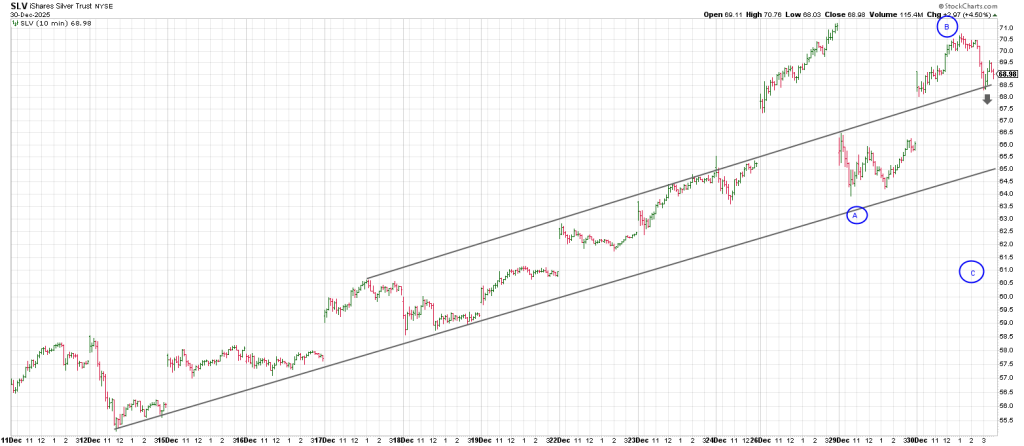
3) At the end of 2025 and early in January 2026, we have a rare quadruple conjunction, a four planet conjunction of the Sun, Mercury, Venus and Mars in Sagittarius. The indication is for a major top in the stock market. My expectation is for a large sell-off to begin by the end of January or early February…but it could start at any time now.
4) Underpinning January as a turning point is that January 2026 is 53 years from January 11, 1973 which was a major top.
53 is on the Cardinal Cross and hence is square 96 which is important as we are 96 years from 1929.
Consequently we have a square-out with 53 and 96 linking the years 1929 and 1973 with the current time-frame.
5) Maybe something, maybe nothing but the DJIA price high in 1929 was 386.
386 is straight across and opposite mid-January.
From the major 2020 low the SPX is in a culminating 5th wave.
Can it extend? Of course, but it has satisfied the structure and could be complete.
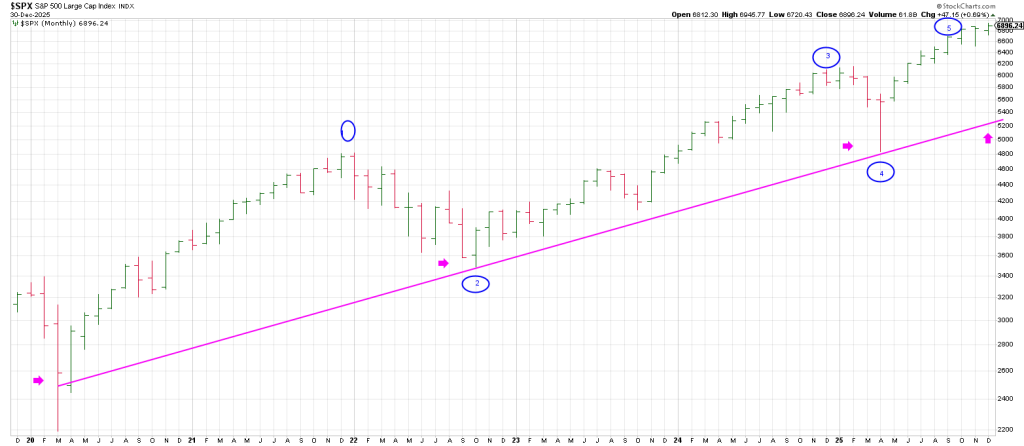
There is a clear 3 point trend line connecting the 2020 low, the 2022 low and the April 2025 low that currently resides at the 5300 region.
There is some good synergy for a top in this 6900-7000 region. Essentially we are up 100% from the October 2022 low.
A 50% correction of the range from the 2022 low to current highs is 5220 ish which ties to the aforesaid 3 point trend line.
I think there is a strong likelihood that Time, Price and Pattern are pointing to a drop to this 5220 region.
Interestingly 522 (5220) is square the first week of March….just like the 2009 bear market low.
If the market is going to swan dive into early March, then the presumption is that 7 to 8 week prior to that will define a pivot high in keeping with the Gann Panic Zone.
7 to 8 weeks prior to the first week of March ties to early to mid-January.
We are 43 years from the start of the secular bull market in 1982,
On the Square of 9 Wheel, 43 aligns with February 3 and 1982.