“Try to catch the deluge in a paper cup.” Don’t Dream it’s Over, Crowded House
“No occurrence is sole and solitary, but is merely a repetition of a thing which has happened before, and perhaps often.” Mark Twain
“What has happened in the past will happen again.” Jesse Livermore
“The future is but a repetition of the past, as the Bible plainly states.” W.D. Gann
“There is nothing new under the sun” King Solomon, Ecclesiastes
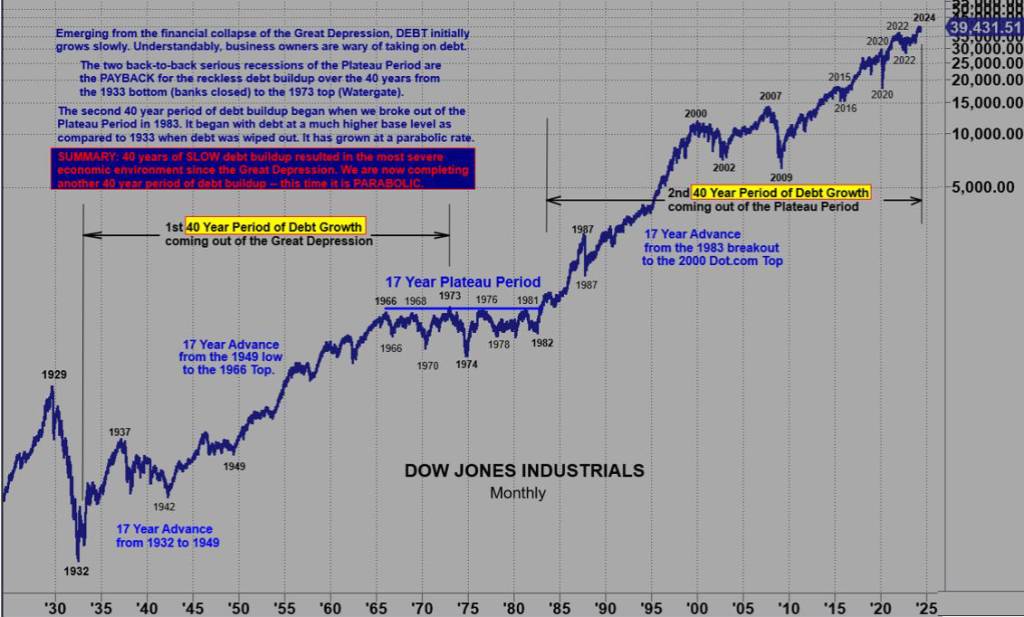
Emerging from the financial collapse of the Great Depression, debt initially grew slowly. Understandably, business owners were wary of taking on debt..
The two back to back serious recessions of the Plateau Period are the PAYBACK for the reckless debt buildup over the 40 years from 1933 when banks closed to the 1973 top.
The second 40 year period of debt buildup began when we broke out of the Plateau Period in 1983.
(notice the low was in 1932, one year before the banks closed and that the low in 1982 was one year before the breakout).
It began with debt at a much higher base level as compared to 1933 when debt was wiped out.
It has grown at a parabolic rate.
The number 40 was important to W.D. Gann. Remember he was a Bible Belt Christian and believed the Bible was a book of coded numbers.
Moses was on Mount Sinai for 40 days and nights.
Moses lived 40 years in Egypt before God selected him to lead his people out of slavery.
40 years after Jesus crucifixion, the Roman Empire destroyed Jerusalem and its temple according to Jesus’ prophecy.
God flooded the earth for 40 days.
In sum, 40 is considered a period of TESTING.
Summary: 40 years of SLOW debt buildup resulted in the most severe economic environment since the Great Depression.
We are now completing another 40 year period of debt buildup. THIS TIME IT IS PARABOLIC.
There is a conspicuous 17 year periodicity shown in the above chart.
From the 1932 low it is 17 year to 1949 when a Secular Bull market started that lasted until 1966.
The Plateau Period from 1966 was 17 years to the breakout in 1983.
A 17 year advance unfolded from 1983 to the 2000 Dot Com Top.
Another 17 years out takes us to 2034.
However, there are cycles within cycles, wheels within wheels.
For example there was an important top in July 1990.
17 years later was the major top in July 2007.
17 years from the July 2007 top is July 2024.
Below we will walk through the significance of the 2007 top which ushered in the Great Recession to where we are in 2024.
Long time readers have heard me say many times that every 40 years something bad happens and every other 40 years something really bad happens.
40 is a key Gann cycle/pattern. Remember the subtitle of his coded novel The Tunnel Thru The Air or Looking Back From 19 40.
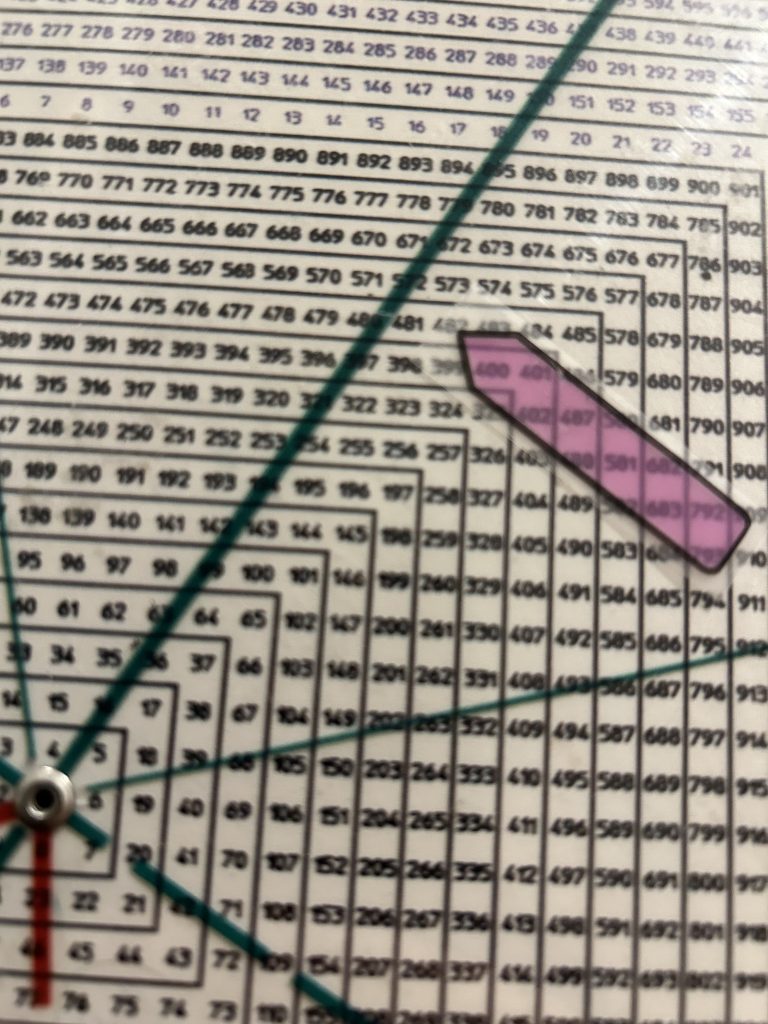
Those who have a Square of 9 Wheel know the significance of the natural placement of 19 and 40 on the Wheel.
19 is a cycle as 19 squared is the 360 degree circle.
360 divided by the last whole integer, 9, gives 40.
Following the initial decline from the peak on September 3, 1929, the market staged a rebound of about 40 days to a Secondary High.
40 days from September 3rd is October 13th and the DJIA rebound ended on October 11.
That was the last pivot high before the trifecta of Great Crashes in late October 1929.
To this day the time period around the October 11th vibration has remained extremely important.
It marked the Secondary High in 2007 which was somewhat higher than the Primary High in July that year.
Following the initial decline from the peak on August 25, 1987, the market staged a rebound of about 40 days as well.
40 days from August 25th is October 4th. The final rally high prior to the 1987 crash was on October 2nd.
I bring this up for a few reasons.
40 calendar days from this year’s July 16th all-time high ties to August 25 which theoretically marked a Secondary High. We have not been above that 5640/5650 region but clearly are attacking it.
It seems all but a given that a new high will be struck. But stranger things have happened.
It was all but a given that a new high would be struck on August 21st before the SPX rolled over 140 points.
The other reason I bring up the aforementioned late August/early September pre-crash highs in 1929 and 1987 and the October 11 pivot are the significance of anniversary dates to W.D. Gann.
We’re not going to go into why Gann thought anniversary dates were important here, we will later this week.
This week Mr. Market performs a hat trick.
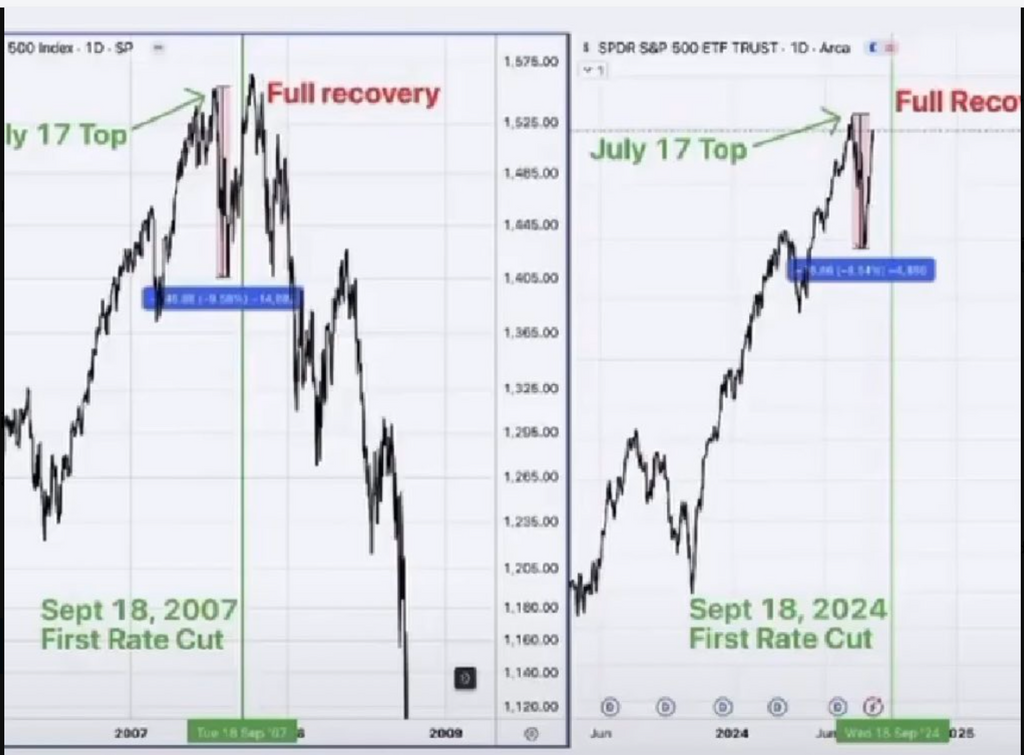
We have the 17 year anniversary from 2007.
The market topped on July 17th, hit an air pocket into early August and started a full recovery into October 11th.
On July 16th, 2024 the SPX topped, dropped into early August and had a full recovery into last Friday.
The First Rate Cut in over a year was September 18th, 2007.
The First Rate Cut in four years will occur on September 18th, 2024.
The October 2007 top came 55 Gann months after the March 2003 low.
October 2024 is 55 Gann months from the March 2020 low.
As well, as discussed last week, we have the Great Depression Cycle poised to exert its influence.
Allow me to explain.
It was 1039 days from the September 3, 1929 top to the July 8, 1932 bottom.
From the primary November 21st, 2021 high counting out 1039 days gives September 26th, 2024.
Counting out 1039 days from the January 4th, 2022 SPX high gives November 8, 2024, the week of the election.
As you can see the cycle that put in a 100 year bottom is synchronous with the time period of the first rate cut in a long time and the election.
This is no ordinary rate cut.
The yield curve has been inverted for over two years, the longest period for such an inversion since 1929.
In 1929 the yield curve un-inverted in May. Then it inverted again and un-inverted just before the Great Crash.
Most all the discussion I see from players is that the yield curve un-inverted just before the Great Crash. They miss the May un-inversion.
This is important because the May un-inversion coincided with the start of the blow-off into early September 1929.
My point is that perhaps it was that un-inversion that got investors/economists breathing a sigh of relief, that things were going to be rosy going forward fueling the last ditch run for the roses.
The yield curve un-inverted on September 6th, 2024.
Is it possible that an echo of that sigh of relief plays out fueling a further speculative episode.
In a word, yes.
On the other hand, we must be mindful that history doesn’t repeat but rhymes…as much of a cliché as that seems, it must be remembered that clichés are often so-called because of how true they are.
In other words we must be mindful that the yield curve un-inverted just before the Great Crash in 1929….and we un-inverted on September 6th.
Putting the pattern of the un-inversion of a long inverted yield curve together with the pattern from 2007’s rate cut the play is this:
Even as little as a 25 basis point reduction in the Fed Rate will reverse long standing policy of higher interest rates, starting in March 2022. Raising through July 23, 2023, holding steady since.
This places the fourth quarter of 2024 and the first quarter of 2025 into the crosshairs of 2007-2008 financial meltdown.
Whether it (The Meltdown) starts this week, or next month, or even in January is less important than the probability that it is coming in the days to weeks to months ahead.
That doesn’t translate to shorting the market out of the gates today, or Wednesday after Fed announcement…or after Powell speaks…or anytime for that matter.
What it does mean is to take every one of any forthcoming Sell Signals seriously with the presumption that it is announcing the beginning of an extended decline and to act decisively in implementing a shorting strategy—ie shorting rallies.
That said, I will be looking to sell a spike higher if it comes on Wednesday.
If the market does not start down between this week and September 26th, the presumption is it will extend into the week of October 11th.
The next time pivot is the week of the election as explained above.
If we should get past early November then the market may hold up until early January in keeping with the pattern from January 2008 when the market went to hell in a handbasket from the opening bell of the year.
Be that as it may, today into September 26th is high on the radar for a top.
Why?
Above I flagged the 1039 calendar day count from November 22 that points to September 26th.
As well counting from the August 5th Flash Crash low, the Gann Panic Window is from September 15th to 26th…as to a culminating run.
That equates to a culminating rally as early as today into September 26th.
That September 26th aligns with the 1039 day 1929-1932 cycle and the Gann Panic Zone should have all our attention.
If we should spike higher into an FOMC Cha Cha Cha, I am looking at 573 (5730) because that
Is 360 degrees or one full rev up from 481 (4810), the January 4th 2022 top.
That said, remarkably, 566/567, the all-time high squares out with Wednesday, September 18th.
My road map suggests a pullback into the FOMC with punishing volatility on both sides of the market Wednesday.