“The master has won, my mojo is gone.” Muddy Waters
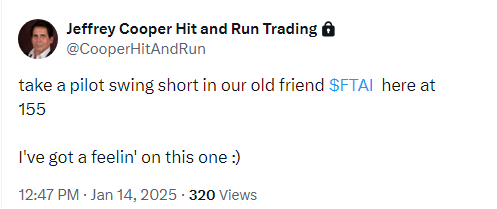
On Tuesday, Hit and Run members took a pilot short in FTAI at 155.
FTAI spiked up 5 points on Wednesday morning with everything else.
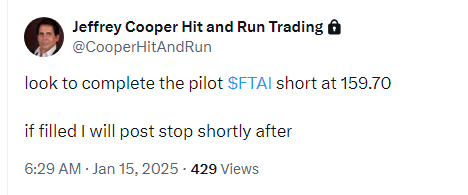
Wednesday’s high was 159.47.
The Hit and Run Private Twitter Feed alerted to completed the pilot short at 156.
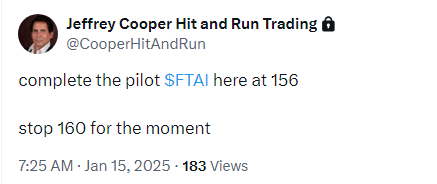
If we’d had a stop in on Tuesday we would have missed the pay off.
You have to know when to break the rules.
But what traders want to know is why FTAI was a short in the first place.
After all it had just struck a record high on January 10th.
Clearly, a pullback was a buying opportunity. Right?
On January 10th, (the day of the all-time high), the financial press ran a story: “FTAI Aviation Shares Skyrocket, What You Need To Know.”
Indeed.
Talk about a headline sell signal.
The Skyrocket turned out to be a Bottle Rocket.
A daily FTAI shows the setup for the plunge.
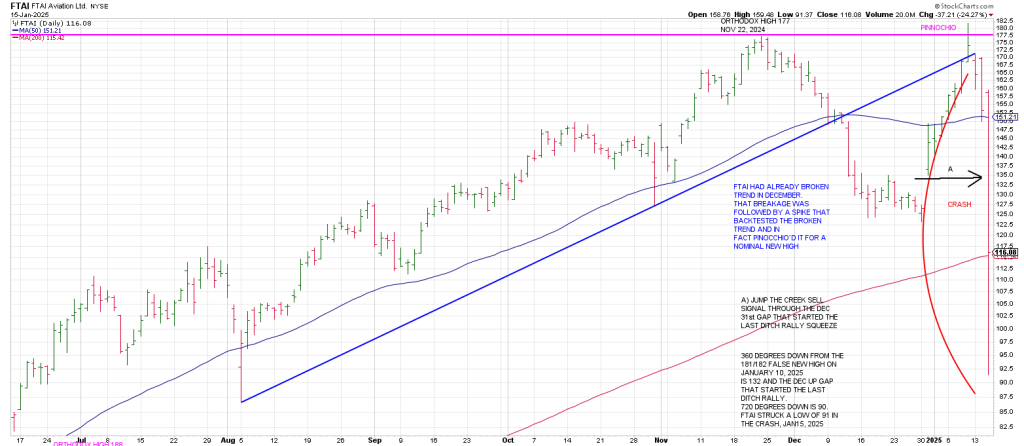
FTAI had already broken trend in early December when it snapped a rising trend line from August (blue) in tandem with breakage below its 50 day line.
Once the 50 day line was reclaimed there was a strong likelihood FTAI was going to test the ATH.
It did.
It Pinocchio’d the November 22, 2024 high of 177 SEVEN weeks later.
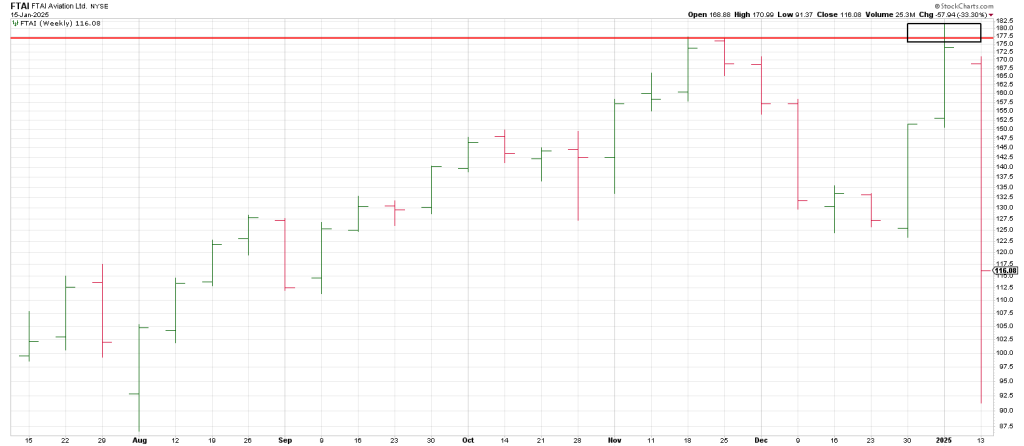
This week FTAI triggered a Weekly Soup Nazi sell signal when it knifed down through the prior November high.
A weekly Soup Nazi sell is a new 20 week high with a reversal back through a prior 20 week high with at least a 4 week interval between the two highs.
I created the setup to identify daily sell setups, but it works just as well on the weeklies.
Let’s go back to the dailies for the blow by blow.
On Wednesday, the first sign of trouble was when FTAI turned red reversing back through its 50 day moving average.
In so doing it turned its 3 Day Chart down.
A turn down in the 3 Day Chart directly off all-time highs should act as support.
In this case FTAI accelerated to the downside, opening the door lower.
The downside momentum targeted 132.
Why? Because that is 360 degrees down from the 181.50 all-time high.
Notice how 132 ties to the open gap where the Last Ditch Rally exploded to test the November peak.
Trade thru the open gap and 132 opened the door to the 200 day moving average at 116.
When that failed to act as support, it opened the door to another full rev down of 360 degrees to 90.
FTAI struck a low of 91.37 on Wednesday before rebounding to close on its 200 DMA at 116.
Knowing where this square down 720 degrees off the all-time high was a sign to cover out last tranche.
Is the market really random?
From the November 22nd peak, FTAI crashed into the Gann Panic Window, 7 weeks from that primary high.
Interestingly, November 22, squares-out with 89, near the 91 low on Wednesday producing a 25 point bounce in the last hour and a half.
Not too shabby.
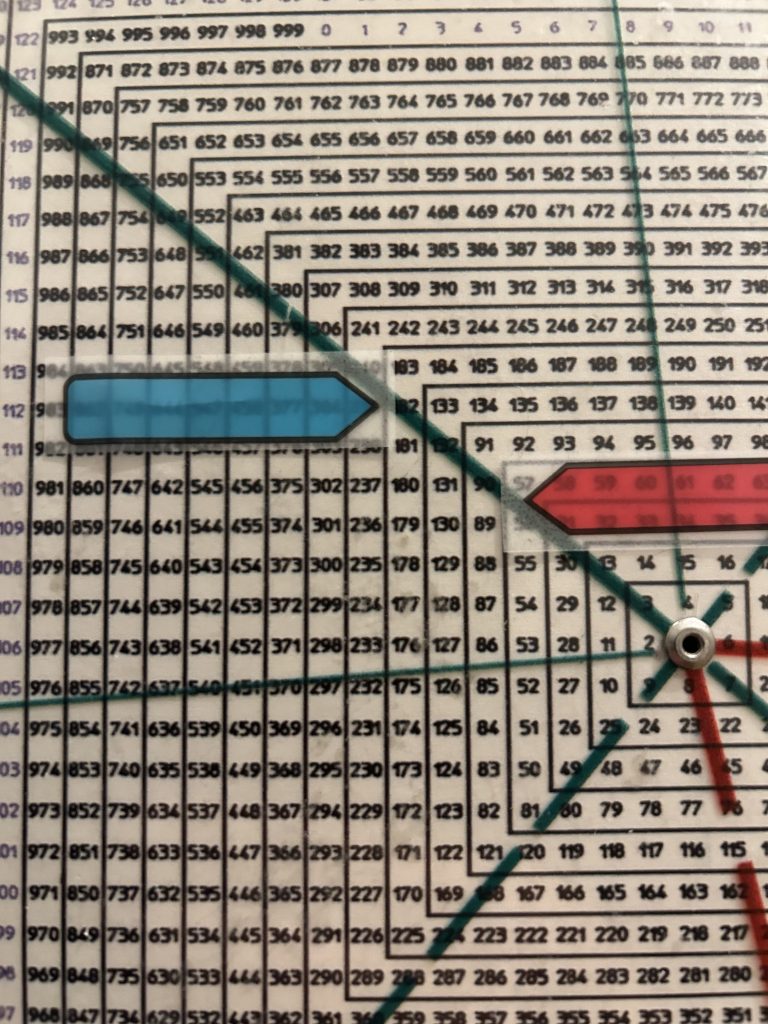
The power of the Square of 9 Wheel points to where to sell strength and buy weakness. It underpins the confidence to buy in the hole and sell into a spike.

Square of 9 Wheel
Purchase your own Square of 9 Wheel. Shipping to US only. Contact Jeff for shipping outside the US.
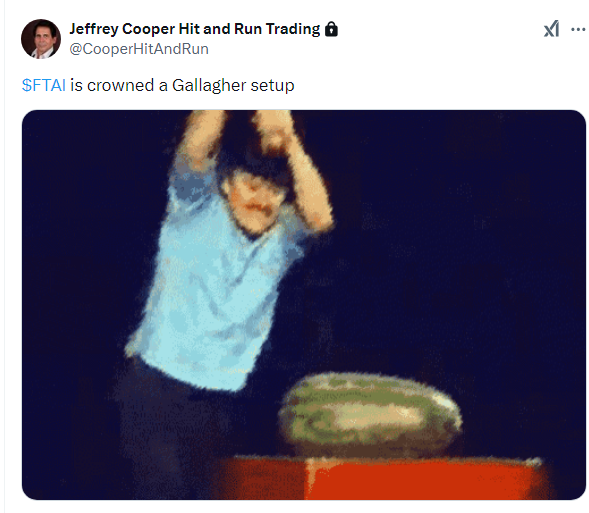
In sum, FTAI served up an iconic Gallagher.
Why is it that these crashes so often follow Buying Climax Spikes?
Someone always knows on Wall Street.
There was a negative story circulating yesterday.
Those in the loop who shorted ‘early’ may have been squeezed producing the dramatic spike 7 Day upside blow-off. Of course as W.D. Gann stated, “7 is the number of panic.”
Was the blowoff it engineered?
I don’t know, but the runaway train clearly collected a lot of bulls, producing a lot of panicky selling as the train came off the tracks.
Was it by design or default?
The Market.
Earlier this week we showed the following daily SPX indicating the potential for a monster rally to backtest its 20/50 DMA Bowtie.
This ties to a backtest of a Ghost Line connecting the August low and the early November low…the low before the high.
The likelihood of a monster rally was backstopped by a push over the “square” at 5860 region which basically nailed Tuesday’s high.
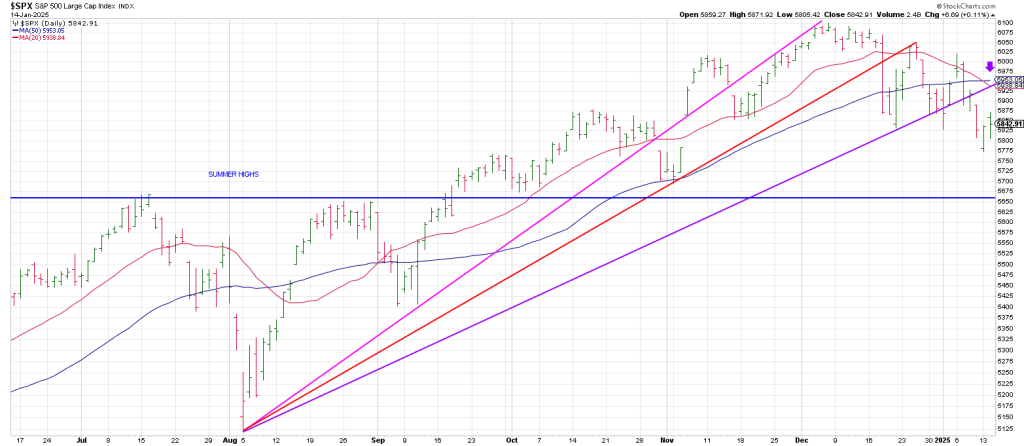
Said another way, Monday’s low satisfied a 360 degree drop from 6100.
The question now is whether momentum above 5945 opens the door to a new all-time high.
I don’t think it matters—just as the nominal new high in FTAI didn’t matter.
Whether the SPX makes a new all-time high or not cycles are due to exert their downside influence.
Just like they did on the nominal new high in March 2000, October 2007 and January 1973…to mention a few examples.
That said, the SPX has an Bear Trap/Undercut and Rally pattern: it undercut a little double bottom (Dec 20 and Jan 2) rallied with authority. So I would not discount the idea of a new ATH.
Nor would I get bullish about the prospect.
It must be noted that bull markets grind higher. Spikes like Wednesday’s typically occur in Bear Markets…unless they are at the bottom of the cycle.
In sum, trade above Wednesday’s high today will turn the SPX 3 Day Chart up.
The ensuing behavior will tell us much about whether the agenda is a new all time high…as will the structure of the next correction…ie, whether it is impulsive or corrective.