“You tell lies thinking I can’t see.” I’m Down, The Beatles
Throughout the second half of 2025 we have been looking at a similarity between the 1920’s and
The 2020’s.
Specifically, as pointed out earlier this year the Roaring Twenties Market was really the 5 years from the 1924 breakout to 1929 mirroring the 5 year period from 2020 to 2025.
There is an uncanny 5 year cycle in the markets.
For example the advance from 1932 to 1937…followed by a crash.
The advance from 1982 to 1987…followed by a crash.
The advance from January 1995 to early 2000…followed by a crash.
The advance from 2002 to 2007…followed by a crash.
Why does the 5 year cycle pack a punch?
For starters it is one-half the Decennial Cycle.
It is also 1/4 or 90 degrees of the Gann 20 Year Time Factor.
5 years ago in March 2020 was the Covid Crash low.
5 Years later in early April 2025 was a major low.
The market exploded after the March 2020 low.
The market exploded after the April 2025 low.
So we are in the 5th year of this cycle.
We have been banging the table about the dangers of November 2025 for a few months.
Yesterday high flyers crashed on the anniversary of the 1929 crash low.
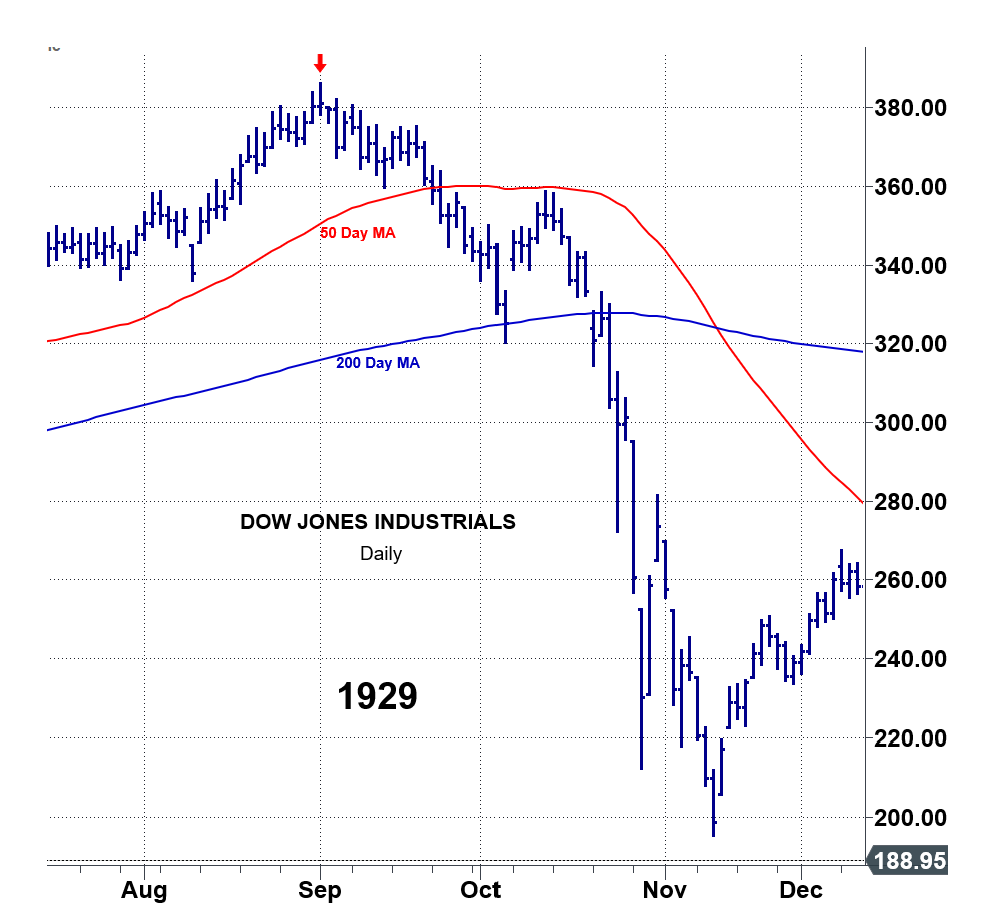
With Thursday’s action the odds increased that the October 29, 2025 all-time SPX high will stand as a major high, the 96th anniversary of The Great Crash in 1929.
You can’t make this stuff up.
We have been speculating that a mirror image fold-back to 1929 will play out.
For example from the September 1929 top to the rebound high in April 1930 is a Gann Panic Period of 7 months.
From the early April 2025 low the market rallied sharply for 7 months into early November 2025.
The ’29 Crash started on Black Thursday October 24. Black Monday October 28 was the worst percent loss but Black Tuesday the 29th is remembered as a day of infamy.
Will we get a Manic Monday?
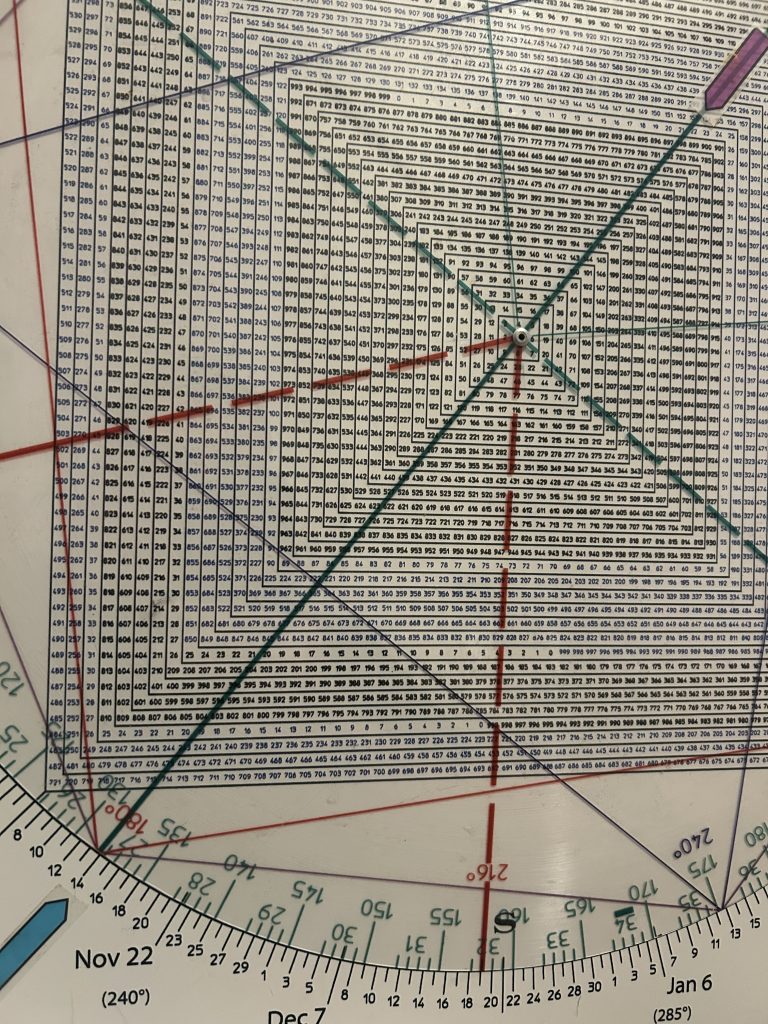
Interestingly November 2025 is 1153 moonths ago.
Eerily, on the Sq of 9 Wheel 1153 is straight across and opposite this time period—November 14 specifically.
The 1920’s were the forerunner to the modern-day ETF—with shell companies purchasing shares of expensive glamor stocks and then issuing shares so that the “public” could afford to ‘play the market’.
In the 2020’s it has been cryptocurrency, and derivatives of crypto and then NFT’s (which in years to come will likely be called Non Fungible Tulips) and Memes and whatever else allows ‘retail’ to speculate with reckless abandon on the promises that a digital trading card is the key to eternal riches.
In each case, those derivative markets take on an oversized impact and importance due to a perilous combination of factors, including Leverage and Liquidity.
When things are going well none of those two factors matter. The leverage allows for increased gains and the liquidity is suitable for handling orders in a bull market.
The problem occurs when things turn negative—which is the case with everything in life.
Think of the beginning of marriage. You’re in love everything is honky dory.
Then one day you decide to go out to the 7/11 and never go back.
Liquidity tends to dry up when everyone only wants to sell.
And now, just a 100 yeasr ago, there are multiple level of derivation—including one that could act in the same exponential l manner on the way down: major corporations suddenly devoting chunks of their working capital into the same speculation.
If the derivatives head lower, their stock could b at risk even if their core business is still doing fine.
These are the moments when history lifts its pointy little head and reminds market participants that there is a world of difference between a company and its stock.
It has to do with the positioning of players. It’s a quaint reality called distribution and accumulation
Which has nothing to do with the merit or lack thereof in a company.
Here’s the pattern I’m looking at.
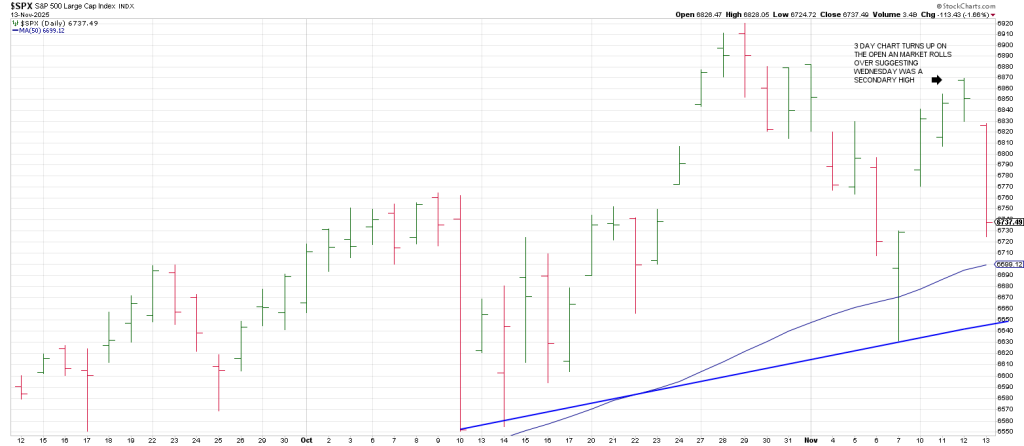
First and foremost, the SPX turned its 3 Day Chart up on Wednesday and knifed lower.
This is a sign of the bear.
When the internal trend is down a turn up of the 3 Day Chart will define a low soon in terms of time and price.
Thursday’s plunge was sharp and immediate followed Wednesday’s turn up of the 3 Day Chart (which also was an NR 7 Day).
In sum, the price action following Wednesday’s setup was conspicuously bearish.
A lot more bearish than the 113 point SPX decline would have one believe.
Many high-flying glamors got whacked.
SNOW, PLTR, SNDK, STX, CIEN, LITE and SHOP to mention a few.
The QQQ closed as close to breaking its 50 day line as it has on any day since the April low.
A similar 3 point trend line on the Q’s as to the SPX comes in at 601
Are we going to get OpEx Pinball Part Deux mirroring our option play last Friday to 600 QQQ?
I connected the Oct 10 low and the Nov 7 low.
That trend line currently ties to around 6560.
If the SPX falls below it 50 DMA which it hasn’t done since it was recaptured in May, it will likely test the aforesaid trend line.
The presumption is that will lead to a short-lived bounce.
When the market rolls over from such a bounce it will be in a position to trigger a Rule of 4 Sell on breakage of this important trend line BELOW THE 50 DMA.
That pattern is precariously similar to what preceded the crash of 1929.
The stage has been set as discussed in great detail in this space for a very precarious 4Q 2025 during the collision of multiple time and price cycles.
Below are the squares down from the 6910 SPX high:
90* down= 6835
180* down = 6753 (we closed below that on Thursday opening the door lower)
270* down = 6671 (which ties to the aforesaid 3 point Maginot Line
360* down = 6590
540 * or a cube-out = 6429
October’s low is 6551.36. Trade below that low by even a penny will turn the Monthly Swing Chart down for the first time since the April low.
If the Monthly Swing Chart turns down and it does not define a low, the door is open for the wheels to come off and a 1000 point SPX decline.
That represents roughly a 50% retrace of the advance off the April lows.
Sound crazy? Not really it’s a relatively normal 15% “correction”.
A 50% retrace of the rally from April ties to 5875.
That represents an undercut of the 200 DMA that hasn’t been tested since May.
Below are the squares down from the QQQ 637 all=time high.
90 * down =611.57
180* down= 587
270 * down= 563
360* down = 539.60
540* down+494.17
Notice that 360 degrees down ties to the 200 DMA.
I think it follows that if the trend line connecting the Oct 10 low and the Nov 7 low breaks, the door is open to the 200 DMA at 541.
In sum, the news breaks with the cycles not the other way around.
Yesterday the market got hit with a one-two punch:
1) Boston Fed president Susan Collins said Wednesday, “the bar for cutting rates further is “relatively high”.
2) Palantir CEO Alex Karp walked right into a trap set by PLTR bears when he stated that some AI
Investments “may not create enough value” to justify cost. Succinctly, that in many cases the cost to build the technology may not be worth it.
He forgot the cardinal rule that when they raid the house they take the Madam too.
It’s will take a lot for the bull to thwart that two-sword Matador.