Yesterday we got a mid-day swoon on some not so dovish words from Fed Chair Powell.
However, the market snapped back sharply on window dressing with the SPX staging a 62 point rally in the last hour and a half.
Staged is right word. Portfolio managers often engage in window dressing at the end of each quarter to make their fund’s performance APPEAR more successful to make it look like they’ve been long winners and to goose stocks they may have been long.
They sell underperforming stocks and buy high-performing ones before the reporting period closes.
This gimmick gives their portfolios a more favorable appearance for investors and clients, even though it may not accurately reflect the fund’s actual performance.
These are the antics the Street passes off to the public as ‘normal’.
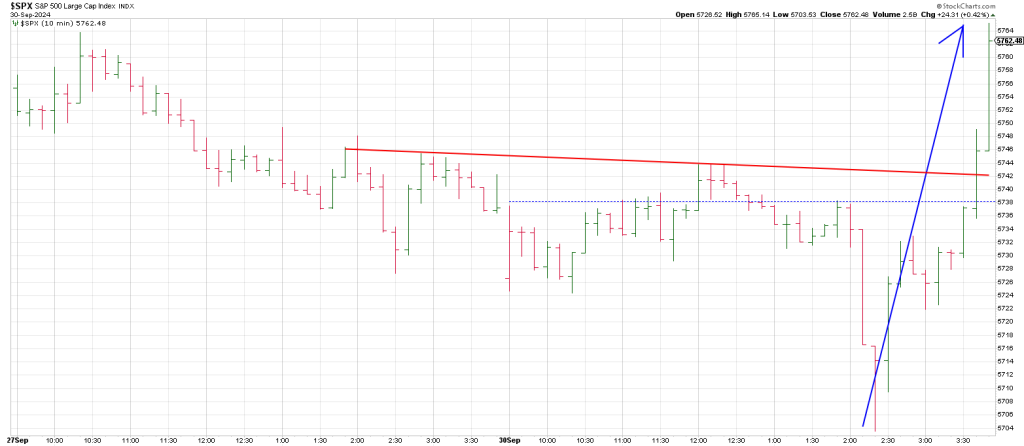
Below is a prime example of this charade: in the final minutes of the third quarter, fund managers dressed up their portfolios for Q3 reporting by snapping up the top performing big cap stocks of the quarter.
This last minute buying spree pushed the SPX up 62 points in the final 90 minutes on Monday.
In sum it created the illusion of impressive stock selection.
Monday’s window dressing failed to generate strength in the SPX or NAZ to boost market momentum, as reflected by the McClellan Oscillator.
Despite the late session price spike, momentum indicators declined underscoring the artificial nature of the late surge.
AAPL up 5 points challenging all-time highs from July 15th is all you needed to know about the index getting high-jacked.
Yesterday we showed how 95 squares-out with October 2-4 with 2024 being 95 years from 1929.
So if this week is an important square-out potentially, what prices vibrate off this week on the SPX?
563 (5630) squares this week, as does 586/587 (5860-5y70).
Is it possible to get 100 points of rally in the SPX before the end of the week?
Of course it is.
Alternatively we could theoretically drop to 5630, just below the prior all time highs.
Today we have the longshoreman’s strike.
Is it just another brick in the wall of worry like the escalating Middle East War?
Interestingly there were multiple strikes in earkt October 1929.
One in North Carolina saw the massacre of six people.
The market massacre was just weeks away.
Today will be a good test for momentum.
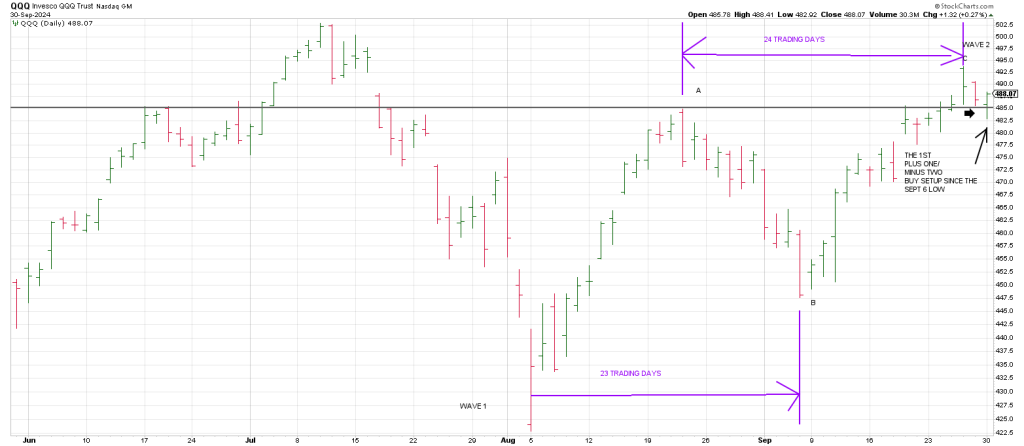
Yesterday was the first time we got two consecutive lower lows on QQQ since the October 6th low.
As such the Q’s are in the Plus One/Minus Two buy position.
There is some strong synchronicity arguing against upside continuation.
The bottoming formation from August 5th to September 6th was 23 trading days.
From the August 22 top to Thursday’s high is 24 trading days.
This underpins the idea of a possible A B C corrective wave structure off the August 5th low for a Wave 2 high…following Wave 1 low from July 10th to August 5th.
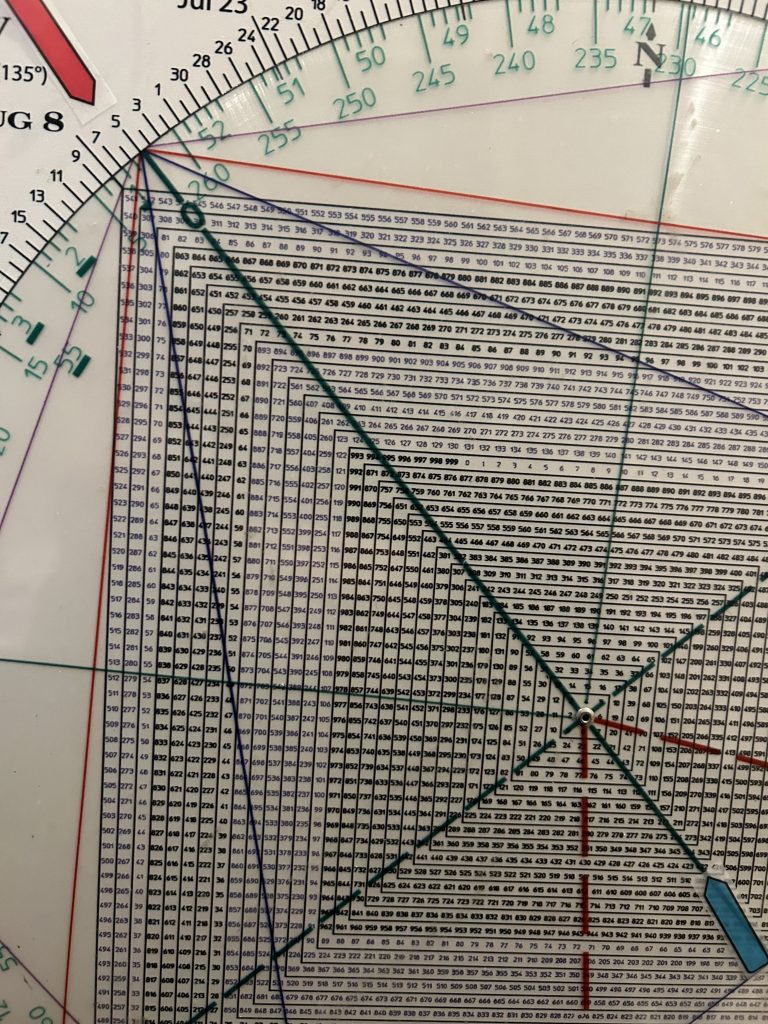
Notice how August 5th squares out with the low that day of 423.
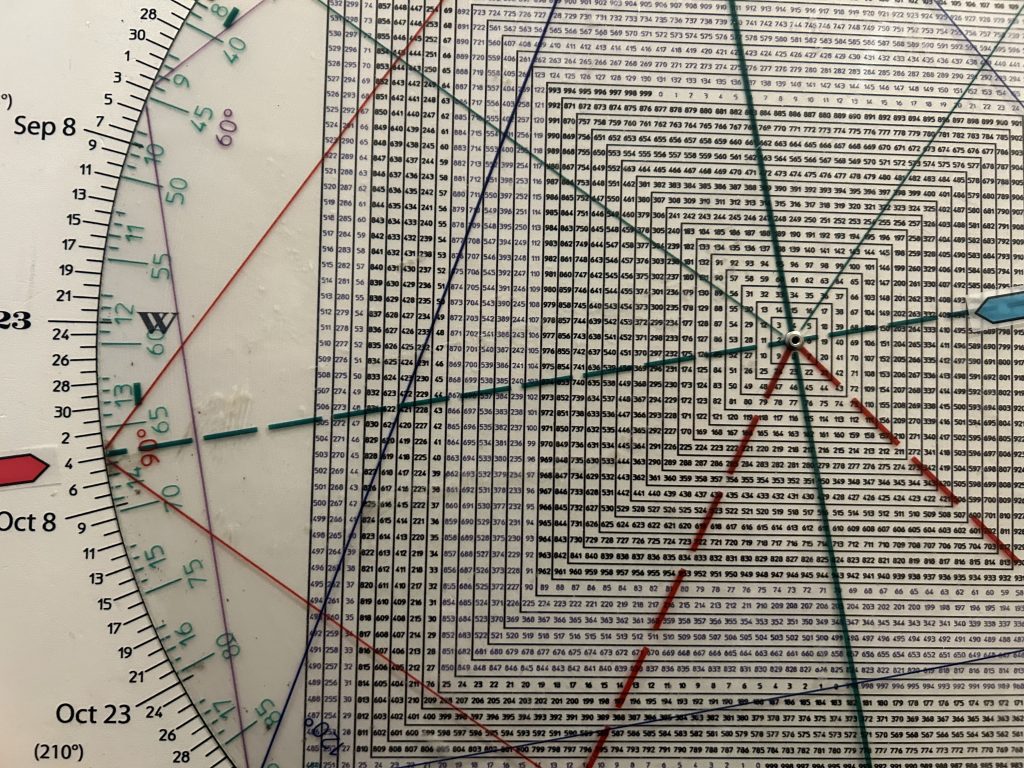
Notice how last Thursdays reversal high of 494 squares out with this week (October 4th).
I think the takeaway is we need to be mindful of a test toward last weeks highs this week.
Can the Q’s push past 494?
Tomorrow: more on the natural cycles comparisons with 1929.