There are many ways that extreme optimism of advisors, managers, individual investors and traders registers in markets.
One of those is small traders’ expectations for rising prices in the options market (10 contracts or less).
The small trader put/call premium is a ratio of total premiums paid versus total call premiums paid.
At .36 the latest three week average is the lowest since November 26, 2021.
This was basically coincident with the peak for the NDX on November 21, 2021…shortly before the big declines in 2022.
Small traders are swinging for the fences again in the options market and this is a blaring alarm in league with the 3 drives up in the QQQ since the April low.
QQQ is the spear of the speculation.
A daily QQQ from the October 26, 2023 low of 342 shows the potential for channel convergence next week around 510.
This is there the top rail of the black channel interests with the to rail of the smaller red channel.
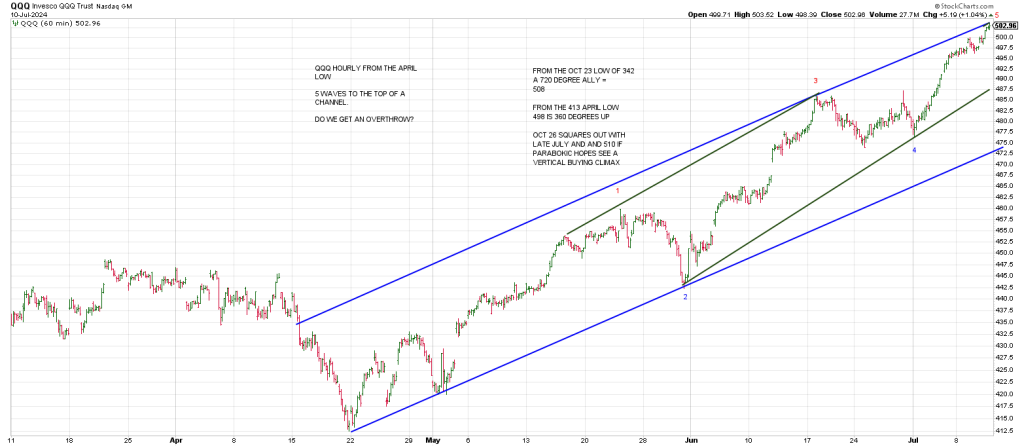
From the 342 Oct 2023 low 720 degrees up is 505.
Oct 26 squares-out with 510/511 in mid to late July if the Q’s want to extend.
However 498 is 360 degrees up from the April 413 low.
Yesterday QQQ well exceeded 498 with a close at 502.
The presumption is 510 is on the table.
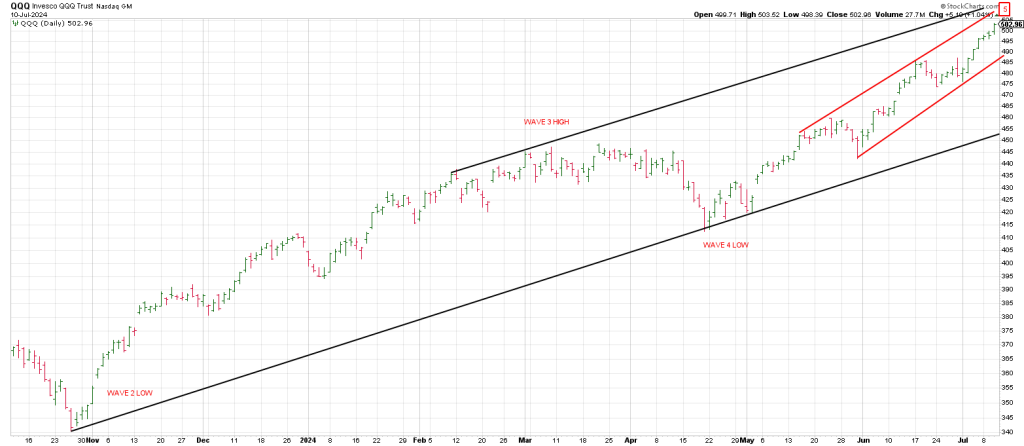
Clearly back below 487 opens the door to a test of the April low.
The drive from October 2023 into the March/April high is consistent with a 3rd wave.
Likewise the drop into April 19th is consistent with a wave 4 correction.
From April 19th a clear 5 wave count shows.
It is a matter of how far wave 5 extends.
Any reversal from here that is impulsive (5 little waves down) that turns the 3 Day Chart down and sees downside FOLLOW THRU warrants caution.
Drilling down to an hourly QQQ shows the structure from the April low.
Breakage below 487 gets my attention.
Clearly the momentum from the May 31st low is a wave 3 of some degree followed by a A B C corrective move.
It looks like we in a 5th wave blow-off.
Given that we vertical nature of the advance since April an Overthrow of the blue trend channel is a conspicuous possibility —in league with the Principle of Squares (510).
If the Q’s are the spear of speculation, NVDA is the tip of the spear.
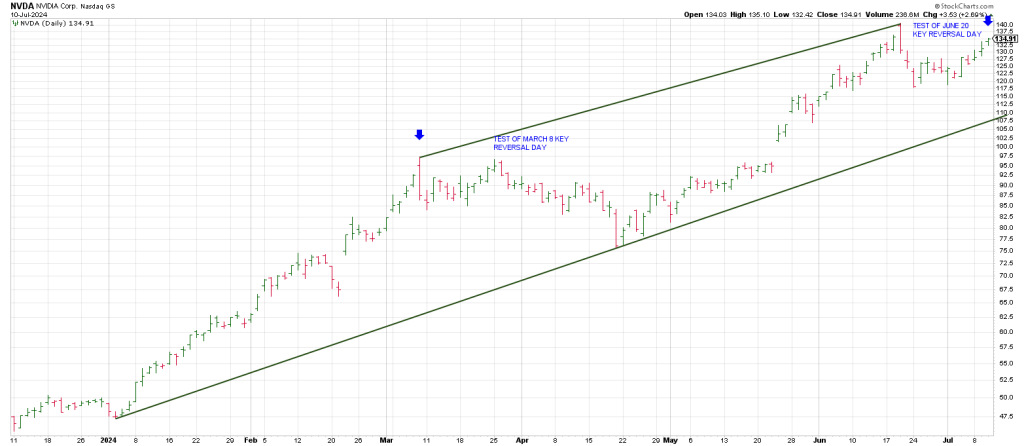
NVDA declined from a large range key Reversal Day on March 8.
Following a test of the KRD, NVDA for 6 to 7 weeks into April 19th.
Classic Gann 7 count til the turn back to the topside.
NVDA installed a second large range key Reversal Day on June 20th.
The 3 Day Chart turned down into June 24th on an undercut of the 20 DMA and following a little double bottom NVDA turned back to the topside again and is testing the Key Reversal Day.
Last week on the private twitter feed we posted that NVDA projected to 136 region.
Why?
From the April low of 75/76 NVDA cubes-out 540 degrees up at 135/136.
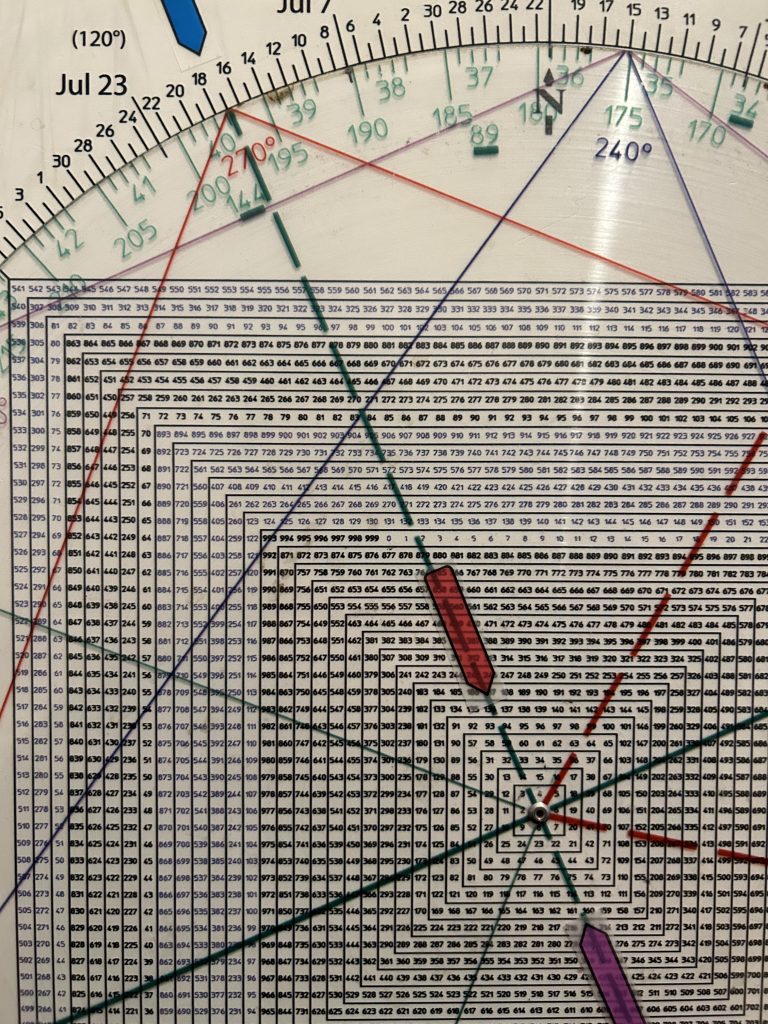
What’s a cube-out?
A cube is a true square. A cube has 6 sides consisting of 6 angles of 90 degrees.
90 X 6 – 540 degrees.
A true square-out is 540 degrees.
I noticed this 540 degrees in Price and Time when I was doing research for my DVD course Unlocking the Profits of the New Swing Chart Method.
It analyses all the big swings from 1941 to 2004.
I was amazed to see how many price swings were 540 degrees and how many swings were 540 days (18 months).
A light bulb went off.
In sum, this morning pre-market, NVDA is trading up to 136.
If it reverses from this test of the June Key Reversal Day, over coming hours/days, the second mouse may get the cheese for the bears.