“In bull markets people put a premium on promises, and in bear markets, they put a discount on reality.” Jim Chanos
“Stop walking down my street
Don’t come around here no more
Who do you expect to meet?” Don’t Come Around Here No More, Tom Petty and the Heartbreakers/Dave Stewart
The momentum train has been running on tech tracks.
If we take a look at a daily QQQ we see an interesting chart.
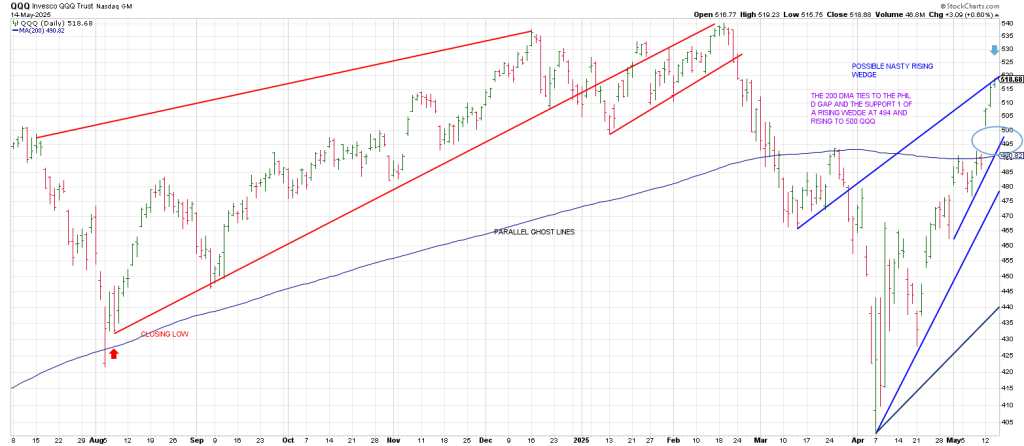
First, let’s go back to the blow-off… from early August to mid-December.
I drew a Bottoms Line from the closing low in August connecting the lows of the blow-off.
The Bottoms Line was broken in early January.
Notice how the breakage perpetuated a Return Rally to backtest/Pinocchio the prior Dec high on Feb 18/19.
In sum, the Bottoms Line of the blow-off extended out into the future becomes a Ghost Line.
Mr. Market recognizes these poltergeists from the past.
I drew a line from the bottom of the first break in January and paralleled that off the original Bottoms Line.
It created a little 3 point trend line.
When that broke on February 21, the Bear came out of hibernation.
Next I paralleled a trend line from the bottom of the first leg down parallel with the red Ghost Lines.
Notice how the Q’s backtested that blue Ghost Line Tuesday and Wednesday.
Then I drew a Bottoms Line connecting the April 7th low for the move with the Secondary Low on April 21.
It produces an extraordinarily large potential Rising Wedge.
The degree of the current potential Rising Wedge underpins the prospect for a possible vicious C Wave decline showed in yesterday’s report.
I paralleled a shorter Bottoms Line off the April 30th low.
This trend line ties to the 200 dma and the open gap from the Let’s Make A Deal Gap this Monday.
The normal expectation if you’re a bull would be for a backtest of the 200 day moving average into Phil D Gap.
If you’re a bull, you should hope for this to play out: markets inhale and exhale.
If all it does is exhale, it will collapse of exhaustion.
That pullback started yesterday in league with our presumed May 13 turning point.
Despite small green closes on both the SPX and the QQQ, many names that spear-headed the rally started to pullback, albeit modestly.
Names include TEAM, CRWD, AMZN, CROX, TEM, HIMS and RH to mention a few.
Despite a 127 point gain in the NAZ and a 6 point advance in the SPX, underlying market action remained notably weak outside a narrow range of mega-cap tech stocks.
TSLA extended smartly
NVDA continued its ramp but may be carving out a 3rd higher low if it stalls out below its Feb low.
ARM extended…only to backtest its 200 dma.
CRS continued into new blue sky territory.
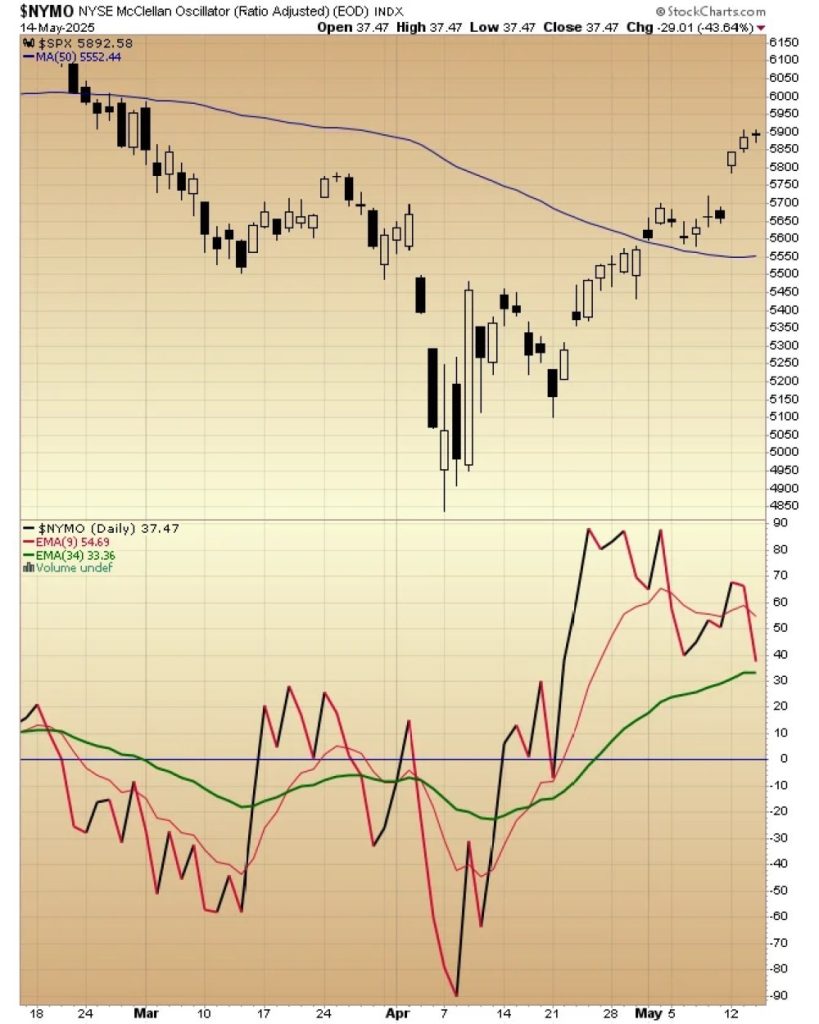
The DJIA fell 89 points and the NYSE recorded 916 more declining issues than advancers.
The NAZ was even weaker with net declines totaling 1,257.
Momentum deteriorated sharply, highlighted by a steep drop in the MYSE McClellan Oscillator below.
Checking GLD shows continued selling pressure.
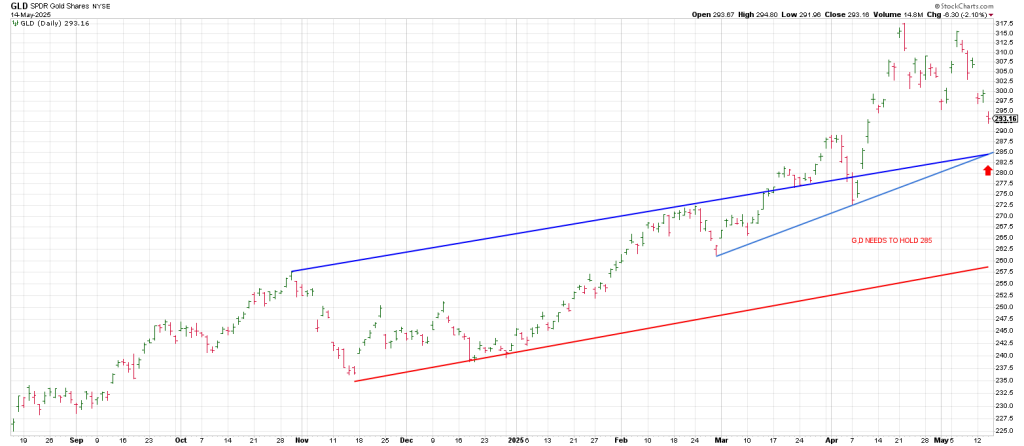
Gold is down sharply again overnight.
It looks like it will be magnetized to a trifecta of support this morning.
1) The light blue Bottoms Line connects the March and April lows intersecting at 285 region.
2) A dark blue Tops Line marks the breakout of a Cjup and Handle that triggered a melt-up in March.
Notice that the breakout was followed by a backtest of the light blue trend line. That pullback looked like a failure but it put the Hook in for a Star Burst pattern into the 317/318 April 22 Gilligan signal reversal bar.
The return rally to challenge that high put the Hook in to the bulls on the Friday before The Tariff “Deal”.
On good Hook deserves another.
I can’t help but wonder if the hook at the early April low to a test of the 50 ay line is being echoed here with another test of the 50 day line.
The question is whether an A B C buyable pullback is in play or whether an important double top is on the table.
3) 180 degrees down from the 317/318 high is 282/283.
Today squares out with 287.