Friday’s plunge broke short-term support.
Yet, almost everything I read over the weekend suggests this will produce a another buy the dip opportunity.
However, downside follow through suggests the Flash Crash may just be beginning.
Why?
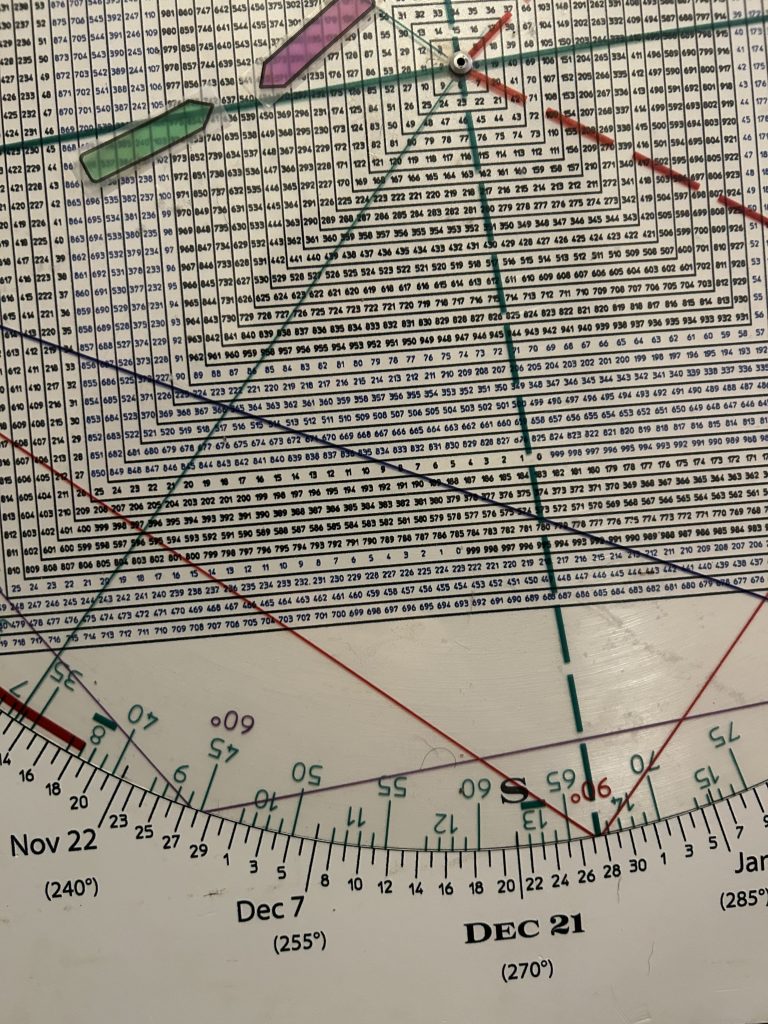
This time frame coincides with the Gann Panic Window, 7 weeks from the October 29 all-time high.
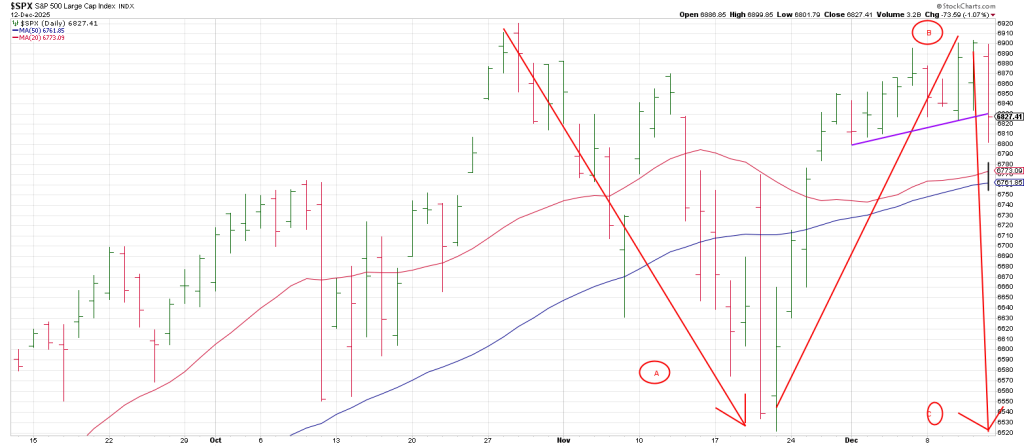
A daily SPX shows the close below December’s rally phase.
50% of the range from the November 21 low of 6522 to Thursday’s high of 6903 is 6712.
This ties to the 50 day moving average at 6762.
There is a strong likelihood, even in a bullish complexion, that the 6712-6760 region will be struck this week.
The complacency accompanying Friday’s downdraft flies in the face of what may be the kick-off of a dramatic Wave 3 decline.
If the decline from the October 29 low to the November 21 low is an A Wave down followed by a B Wave counter-trend rally into last Thursday, then this decline may just be starting a pernicious C Wave plunge.
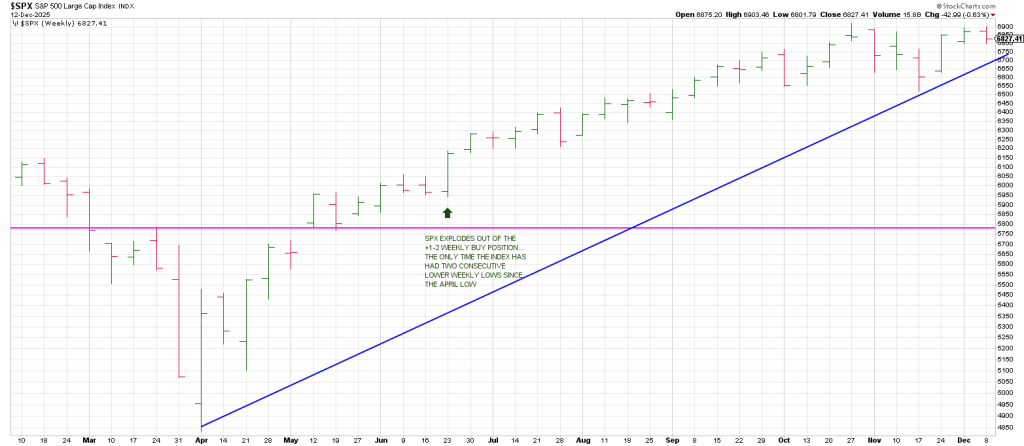
Interestingly the SPX has only carved out 2 consecutive lower weekly lows once since the advance from the April low started.

This was the two consecutive lower weekly lows into the week of June 23.
Actually the second lower weekly low put the SPX in the weekly +1/-2 buy position.
The SPX didn’t hesitate. It exploded immediate.
Notably December 21 ties to 180 days/degrees from the late June setup.
Recently we walked through the synergy of December 21 and the Great Jupiter/Saturn Conjunction on December 21, 2000.
So essentially the SPX has only traced out 1 weekly lower low throughout the advance.
Every instance of a one-week turndown in the weeklies has defined a low.
No wonder bulls are salivating over the prospect of a another buy the dip on a turndown of the Weekly Swing Chart.
This will occur on trade below Friday’s 6801.79 low.
The behavior following a turn down in the weeklies will give us a lot of information.
That said it would not be surprising to get two consecutive weekly lower lows for a clear-cut, unequivocal weekly Plus One/Minus Two buy setup.
If that occurs and the market doesn’t get traction the likelihood is we will see the first turndown in the SPX 3 Week Chart since the April low.
If the 3 Week Chart turns down and it does not define a low, and the index continues lower (potentially after a knee-jerk bounce), it is the Sign of the Bear.
It is a sign that we are in the heart of a Wave 3 decline.
A Wave 3 decline is likely to target 360 degrees down from this 6900 top region.
This is 5890.
There is some good synergy with this level as 50% of the April/October range is 5877.50.
A Bottoms Line connecting the April low and the November low comes in this week at around 6700. This ties to 50% of the range from the November low to last weeks high.
In sum, the 6700 region looks like the Bull’s Last Stand for this cycle.
Checking the Q’s shows a more unequivocally bearish assessment.
The Q’s turned their 3 Week Chart down right off their all=time high on October 29 testing their 20 week moving average for the first time since the April low.
The first test of the 20 week ma elicited a rally which is the normal expectation.
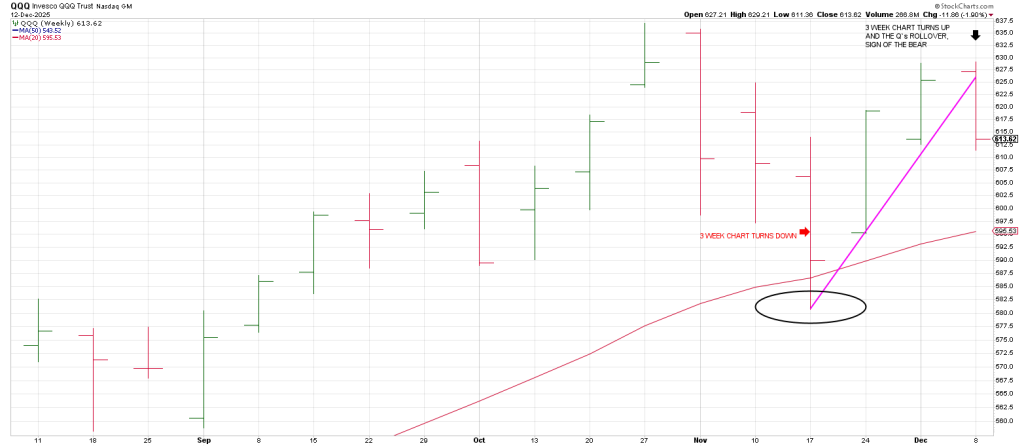
Breakage below the circled 3 week chart low at 580.74 opens the door to yet lower prices.
The likelihood is below 580.74 perpetuates a drop to 544 and the 50 week moving average.
This ties to a test of the February 2025 high.
360* down from high is 540 and squares-out with late December.
The Q’s closed on their 50/20 daily ma Bowtie Friday.
A Breakaway Gap to the downside today is conspicuously bearish keeping pressure on to the downside as long as the gap remains unfilled.
It is worth noting that October 29 carved out a 6 day Island Top with last week’s rally satisfying Phil D Gap.
In sum, we will take our cue from the Q’s—the leader.
They turned their 3 Day Chart down on Wednesday and rallied.
Wednesday’s low of 620.99 is the circled 3 Day Chart low.
The Q’s staged a Miss Direction Day on Thursday as they violated the circled 3 Day Chart low, rallying to close on their high.
Friday corrected Thursday’s Miss Direction Day—the Q’s closed below the circled 3 Day Chart low.
Importantly this occurred on the Friday weekly closing basis.
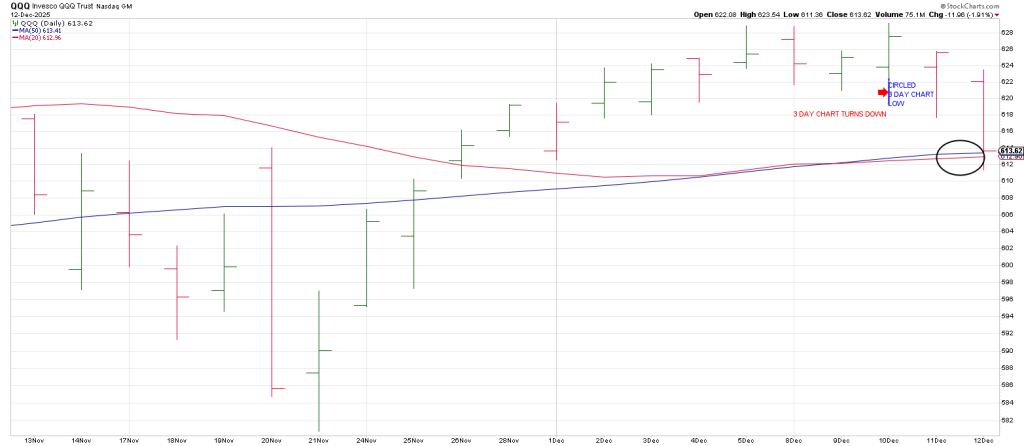
However, the Q’s closed on their 20/50 dma Bowtie and along with the projection of the Roadmap, this could perpetuate a very short term knee-jerk bounce as the bulls try a stick save to save the baby going into year end—there is nothing they would like better and nothing they would not resort to in order to attempt to push capital gains into next year.
That was the playbook for late 2007 going into January 2008.
Conclusion. The Q’s may trace out a Minus One/Plus Two sell setup with 2 consecutive higher daily highs.
I highly doubt this would occur on Tuesday given Friday’s large range.
In other word the Q’s are not going to turn their dailies up today.
So the presumption is Wednesday is when we could see two consecutive higher daily highs—IF we’re going to.
Short term cycles per the Roadmap also suggest the market will establish a significant pivot high on or before Wednesday, followed by a significant correction.
IF THE Q’S GO INTO THE MINUS ONE/PLUS TWO SELL POSITION ON WEDNESDAY WE WILL BUY QQQ PUTS.
If the Q’s go into the daily -1/+2 sell position, I expect a reversal that spills into Thursday.
The indication is traders should prepare for increased volatility over coming WEEKS. Directional traders should remain cautions.
That’s saying something given the action since Fed Day.
The coming days could mark a turning point in sentiment…as traders become disabused of BTFD making this a critical week to watch closely.
Such conditions favor nimble swing traders who thrive in fast-moving markets.
Hello.
Long-term investors, however, will find this period challenging, as sentiment could shift quickly.
Patience and discipline will be essential as the market navigates this turbulent cycle
Of course we already know this as we are in the heart of the Gann Panic Window.
I anticipate the potential for a sharp one-day decline of around 3% this week.