“I was sittin’ in a crummy movie
With my hands on my chin
All the violence that occurs
Seems like we never win.” Brian Wilson, Love and Mercy
“The word cosmic is in danger of losing its ‘s’” Vladimir Nabokov
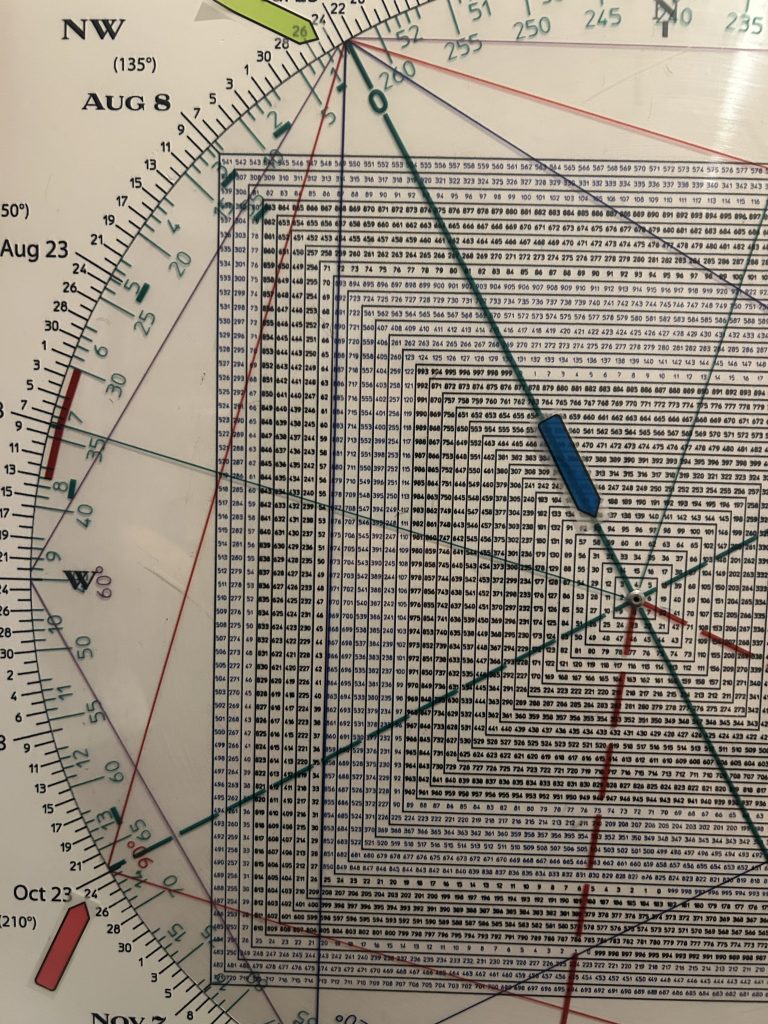
Saturday was the Summer Solstice, the week of which marks a natural Gann turning point.
In W.D. Gann’s methodology, solstices and equinoxes are considered natural turning points, shifts in energy that may affect market sentiment and direction.
These beginning of the seasons are believed to influence market cycles—either trend reversals or accelerations.
Since Gann stated that “Time is more important than price” it is important to watch market behavior around these seasonal divisions of the 360 degree year.
Last year the SPX struck a high on the week of July 8th, 2024, just after the Summer Solstice.
180 degrees later in mid December the SPX knifed lower marking the Momentum Peak for the rally from October 2023.
From the Spring Equinox on March 21, 2025, the market crashed.
Consequently, the current time frame represents a cluster of time vibrations:
We are 90 degrees from the Spring Equinox—Gann’s Zero Point.
We are roughly 360 degrees from the early July 2024 high.
We are 180 degrees from the December 2024 Momentum Peak.
We are 720 degrees from the early July 2023 high.
We are 7 ½ years (an important cycle of 360 weeks) from the January 2018 Volmageddon Peak, a time that marked a period of extreme volatility.
In recent reports this month we noted the significant symbolism of this particular time frame that W.D. Gann pointed to in his coded novel The Tunnel Thru The Air.
The first week of July is also the 93rd anniversary of the July 1932 low following the 1929 crash.
Interestingly, on the Square of 9 Wheel, the number 93 squares October 24th.
This was the beginning of the Great Crash in 1929.
93 also squares out with late July.
In other words early July , the Great Depression low squares-out with the start of the Great Crash, October 24, 1929.
If you think that is happenstance, think again.
I have show hundreds of such major square-outs.
Any Hit and Run member can verify how these have worked in real time in many past instances.
There is some synchronicity between the start of the 1929 crash, the bear market bottom in July 1932 and July 2025…93 years after July 1932.
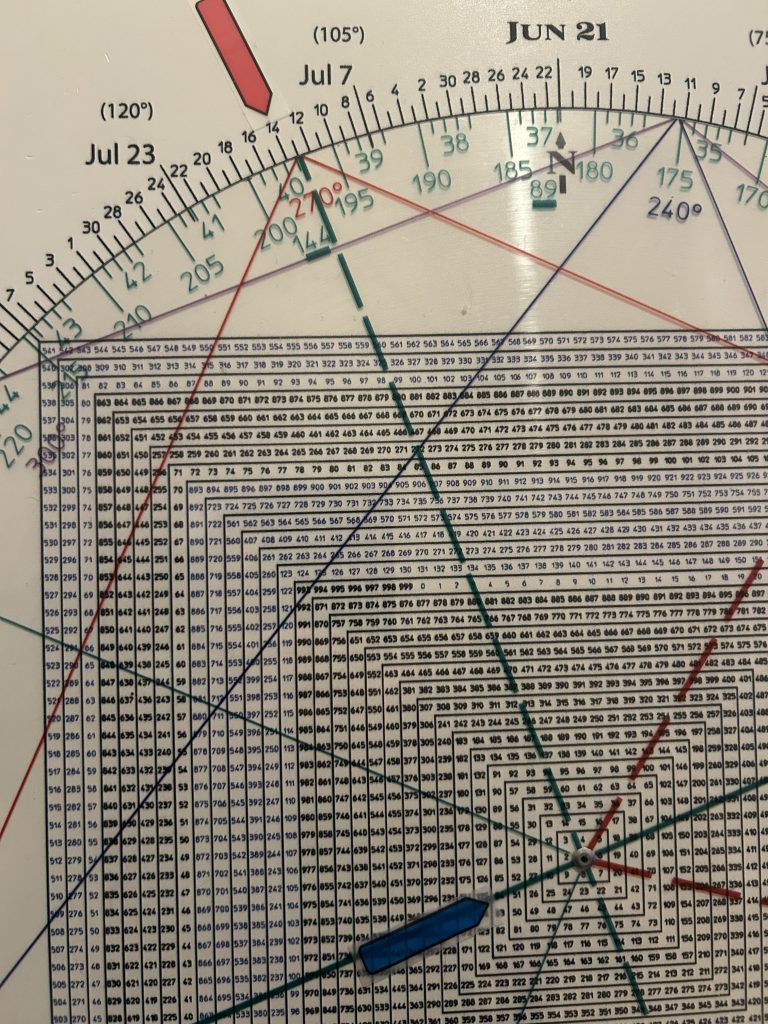
Recently, we walked through the significance of this June 21 and the Summer Solstice.
We are opposite the Great Jupiter/Saturn Conjunction on December 21, 2020, the Winter Solstice.
July is 55 months from December 2020. This is the Crash Zone of Gann’s 49-55 period Panic Window be it in days, weeks, months or years.
For example the 1929 crash occurred 55 days after that years Sept 3 high.
The 1987 crash occurred 55 days after that years August 25 high.
55 weeks, months and years is a fractal of this Crash Count.
The Dec 21, 2020 Jup/Saturn Great Conjunction is so called because it is the tightest such conjunctions in 800 years.
The tightest one before that is believed to be the Star Of Bethlehem.
Are we living in Biblical Times?
Many degrees in time forward and backward from Dec 21, 2020 have been major turning points.
For example the outbreak of Covid one year earlier in late December 2019.
Two years prior marked the Christmas Crash of 2018.
One year after Dec 21, 2020 marked the top in late 2021 prior to a 9 month bear market.
To mention a few.
As I write this on Saturday night, June 21, we now know that the U.S. struck Iran.
Let’s take another look at the war cycles that I thought would start in 2025.
The U.S. entrance into WW2 effectively started with Pearl Harbor on December 7, 1941.
That is 84 years ago.
On the Square of 9 Wheel 84 squares-out with mid-July.
While the U.S. struck Iran on June 21st, it may be 2 to 3 weeks until we see the full ramifications, geopolitically and market-wise.
On Friday the SPX turned its 3 Day Chart down for the 3rd time since the April low.
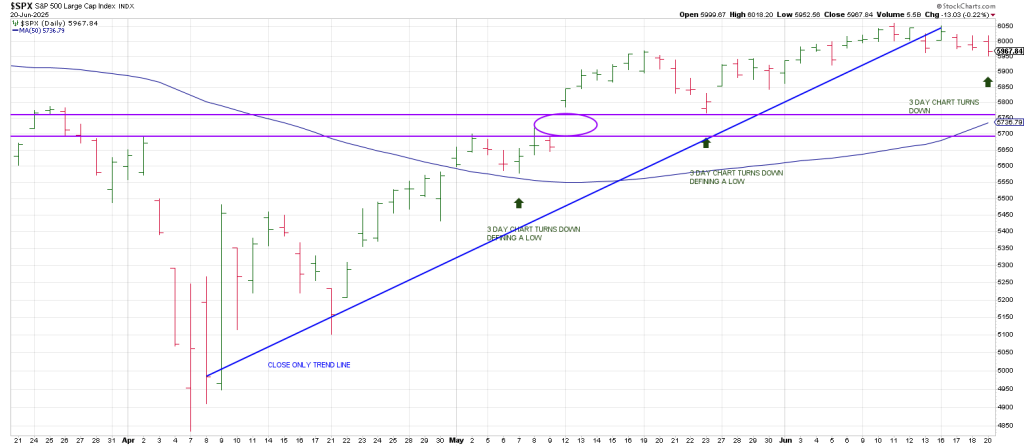
The first instance was May 7.
The second occurred on May 23.
Both defined lows with the market gapping higher within days.
The strong likelihood is the SPX will gap down following Friday’s turn down of its 3 Day Chart.
That does not guaranteed that it does not reverse Monday, but it looks like we have a change of character in the price action and that we are getting a Breakaway Gap out of an Ascending Wedge.
Of course we may close up on Monday and once again the 3 Day Chart turndown will have marked a low.
Be that as it may, breakdowns out of Ascending Wedges are dramatic and powerful.
The idea of a powerful decline is underscored by the possibility that the decline from February into April being an A Wave with the rebound into June being a corrective B Wave.
C Wave declines are vicious.
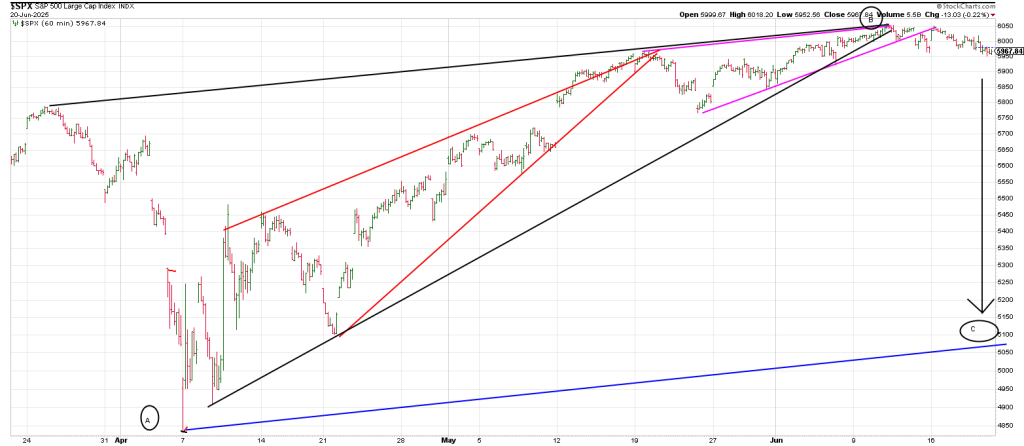
It is possible a C Wave is kicking off just at a time when complacency reigns and the long commitment by retail and hedge fund longs is extreme.
At the very least the presumption is downside follow thru will see a test of the massive open gap from May 12 which ties to the 50 day line at 5747.
That’s 220 points down from Friday’s close or about 5%.
Since the war between Israel and Iran broke out around 10 days ago the market has barely budged.
Is it possible is a major threat in the word is taken out that a strong rally is unleashed?
The price action over the next two weeks will tell the tale.
Expect wild swings and whiplash that could punish most traders this week. Even if the market gaps down on Monday, it may see a surprise squeeze back into the open gap prior to a nasty selloff over coming hours/days.
The lead dog, the QQQ also turned its 3 Day Chart down (3 consecutive lower daily lows) on Friday.
It is also testing its 20 day moving average for the first time since recapturing it on April 23.
Breakage below its 20 dma in tandem with downside follow thru after turning its 3 Day Chart down opens the door to a larger pullback…or even something more nefarious.