A daily GLD from the October 2023 low shows the structure into the record 257 square-out.
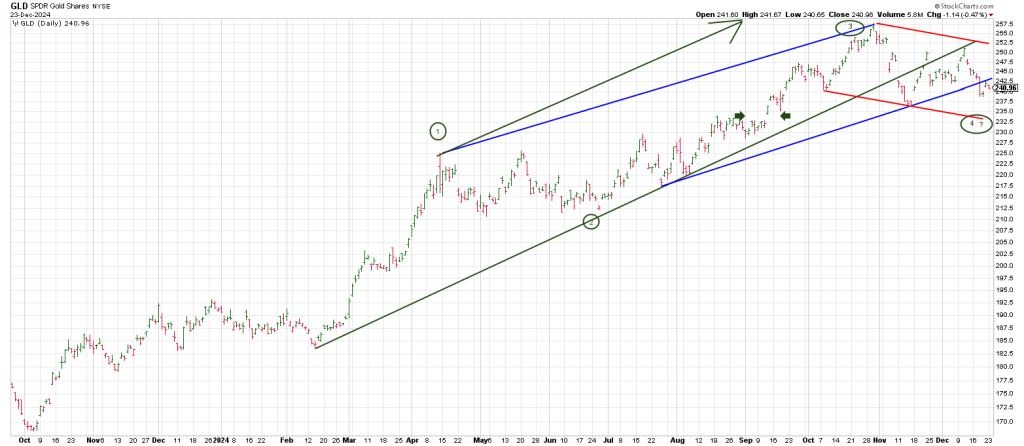
The impulsive nature of the 2024 advance did not start until February when GLD triggered a monthly Rule of 4 Breakout perpetuating a parabolic run.
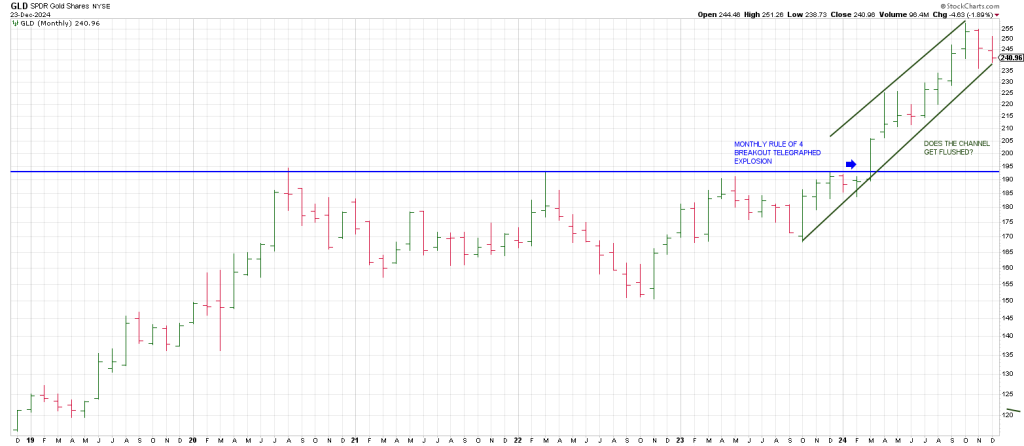
The low for the run was 168 in Oct 2023.
A Sq of 9 Wheel shows 255 is a key 540 degrees up the 168 low.
This cubes out the 360 degree/day advance from October 2023 into October 2024 top.
255 cubes out the move as 540 degrees is a TRUE SQUARE, a cube.
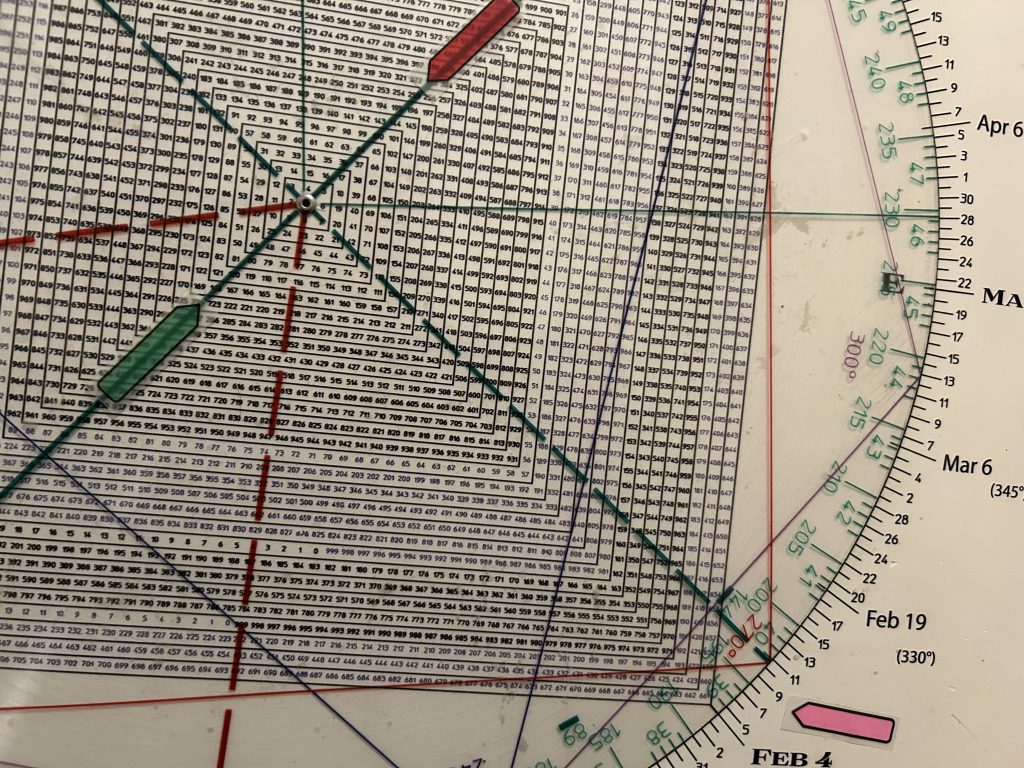
Pretty easy stuff.
Although the market is not a Rolex, GLD Pinocchio’d 255 striking 257.
Par for the course.
This is why when the Street was salivating over golds momentum we changed our tune from our multi-year bullish posture and warned of a multi-month correction.
From our numerous GDXU and GDXJ and UGL long swing positions over the last few years, I think we’ve had one GDXU longside try since the Oct 2024 peak.
A 90 degree pullback from 257 is 241.
GLD has been backing and filling at the 241 region.
However, notice it is threatening to drop further as it has broken the bottom of the blue trend channel.
Below 241 and the bottom rail of the channel opens the door to the 232 region and the bottom of the little red declining trend channel.
90 degrees down from 241 is 225.
Breakage below 232 and the open gap from September points to the potential for a drop to 225.
Hit and Run has had late January on the radar for a 4th wave low in GLD.
Why?
Late January is 90 days/degrees from the October 30th record high.
The 257 high squares February 3rd which is also opposite 241.
It may be that GLD holds the 241 region and tortures bulls and bears alike before taking off.
That said, by definition, since 225 is 180 degrees down from the 257 high and square the 241 square,
225 also squares-out with Feb 3.
By degrees (versus days), January 27th is 90 degrees in time from the October 30 high.
If GLD impulses lower from below the blue trend channel there is beaucoup support at the triple tops aligned with the 225 square.
SLV has declined to the bottom rail of a weekly trend channel that ties to a test of its 50 week moving average which satisfies a test of its 200 day moving average.
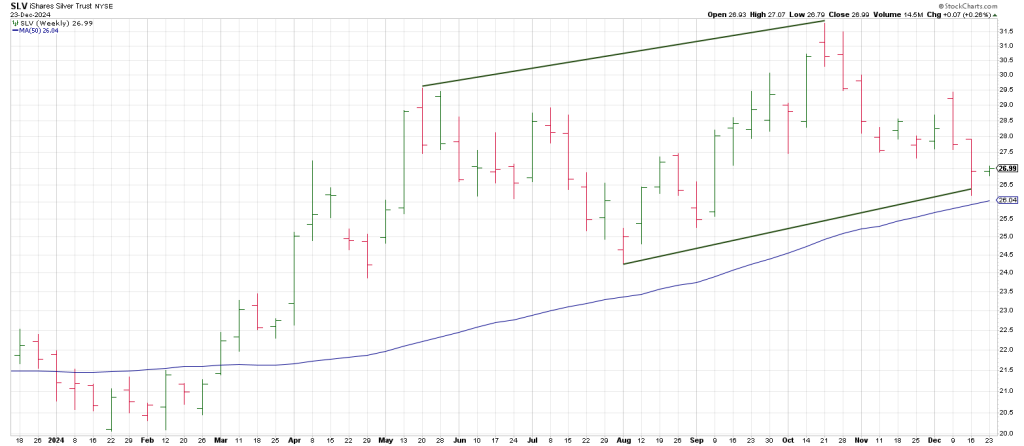
From the October 22 high of 31.80, we see that 90 degrees down is 26.
SLV struck a low of 26.20 last week and tailed up.
January 19th is 90 days/degrees from the October peak.
When SLV offsets the December 18th knife to the downside and sticks, it will be the first sign that a bottom has been struck.
In sum the precious metals rally is not over, but the sentiment has done a 180 from the euphoria in October setting the stage for a potentially dramatic rally where silver sees 50 and GLD sets out to capitalize on the potential to the 300 region.
In the balance of this report I want to look at two recent Hit and Run long ideas reflecting how markets play out in threes.
On Friday before the open we spotted a Plus One/Minus Two buy setup on IONQ which has been in a powerful uptrend.
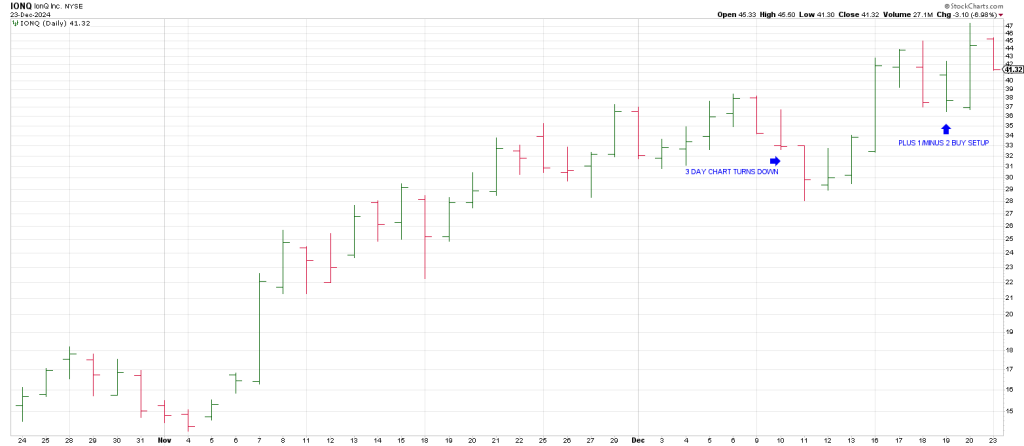
A daily Plus One/Minus Two buy pattern occurs when the 3 Day Chart is pointing down and then you get two consecutive lower daily lows.
On Thursday IONQ went into the Plus One/Minus Two buy position.
On Friday it exploded despite the market being red in the early going.
This relative strength signaled IONQ could be a ‘Torpedo’ setup on Friday.
In other words, damn the torpedo’s, full steam ahead.
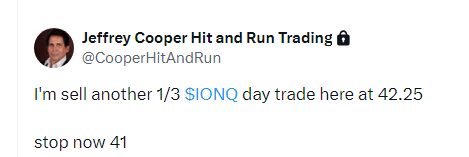
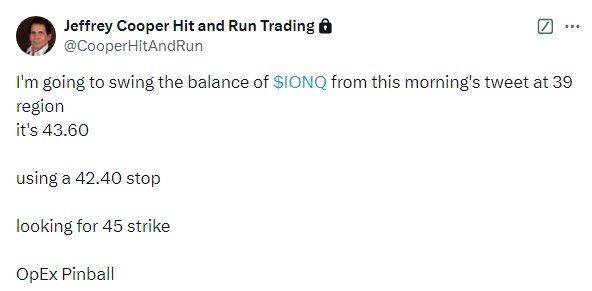

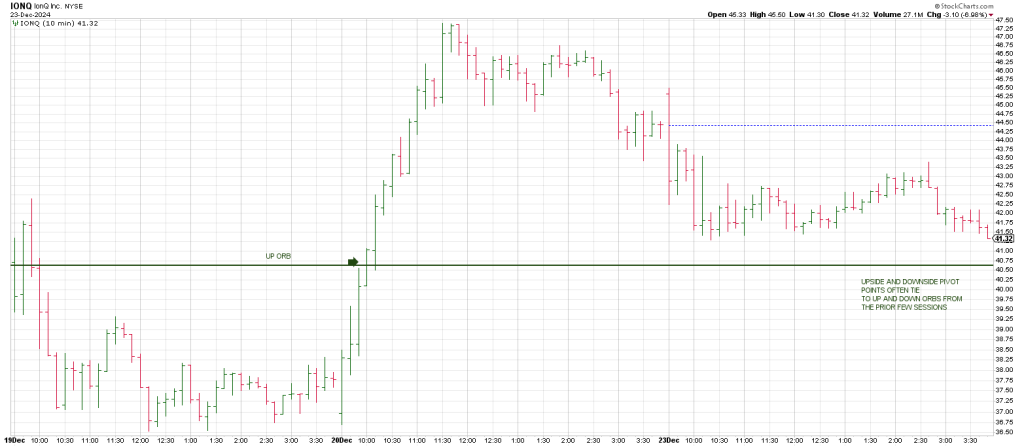
An Opening Range Breakout (ORB) occurred at 40.56, a breakout over the first 30 minutes range perpetuating a rocket just beyond our 45 projection.
Markets play out in threes on all time frames.
This underpins the Plus One/Minus Two buy strategy I created.
The opposite is the Minus One/Plus Two sell pattern.
They both key off the 3 Day Swing Chart.
3 consecutive higher daily highs turns the 3 Day Chart up (not closes)
3 consecutive lower daily lows turns the 3 Day Chart down.
Ditto the weeklies and monthlies.
Let’s take a look at TSLA which was a long swing idea on Sunday night’s report.
TSLA has been in overdrive since a Rule of 4 Breakout on December 5…a breakout over TRIPLE tops.
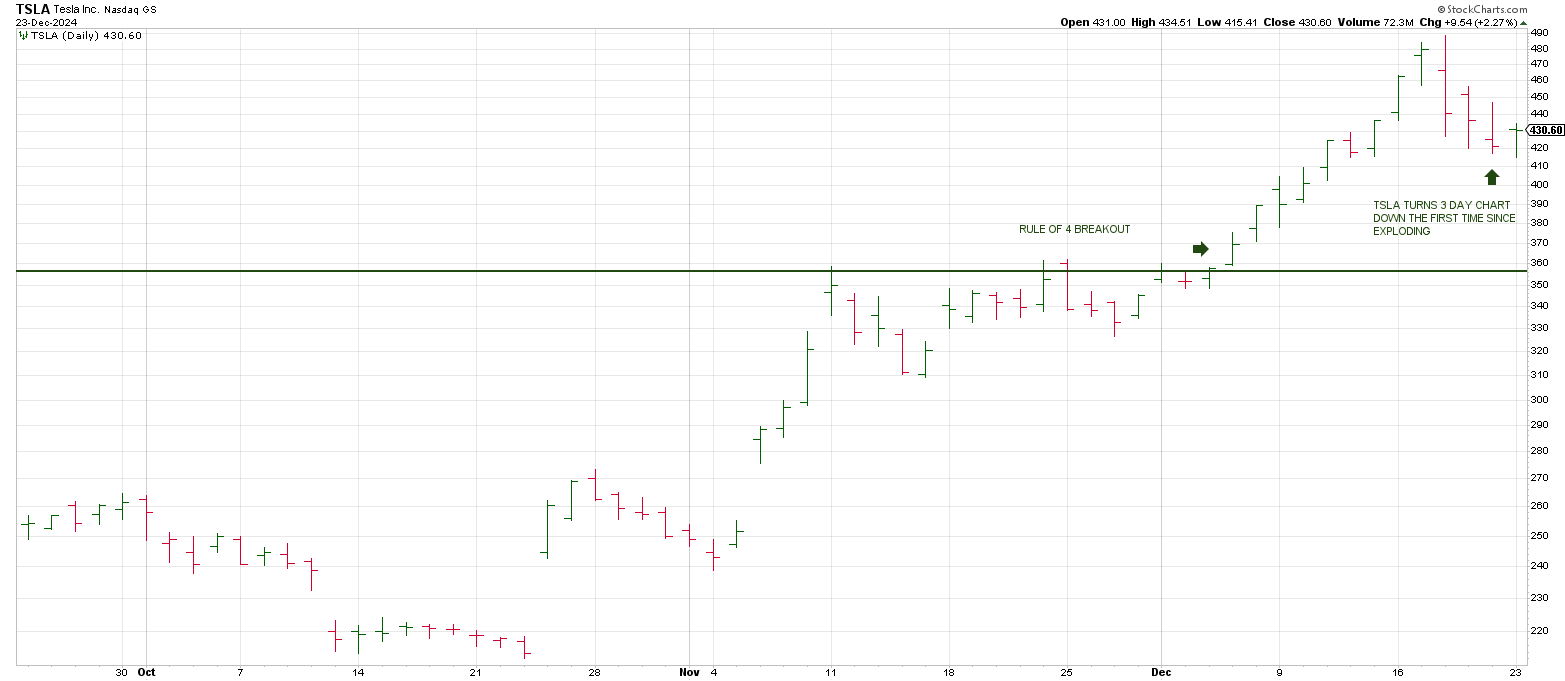
It overshot our idealized 374 square-out last Thursday, but when a stocks reach exceeds its grasp, the reversion to the mean can be stunning.
And so it was with TSLA leaving a large range Key Reversal Day last Wednesday.
It turned its 3 Day Chart down on Friday setting up our buy strategy.
Hit and Run members took 10 points out of TSLA on Monday.
90 degrees up from Monday’s 415 low is 435.
We scaled out at 434.
Clearing 435 opens the door to 456.
Today squares 452.
In sum, there is a Time/Price confluence in the low 450’s today
That’s 20 plus points higher than Monday’s close.
Can TSLA accelerate to electrify the projection today into Friday?
If so, the subsequent price action should be a good tell for the overall market.
Thursday morning’s report will cover Bitcoin following our forecast of a significant top at 105,000-106,000.
I want to wish all of you a very merry Christmas and a Happy Hanukkah. May peace be with you.

Square of 9 Wheel
Purchase your own Square of 9 Wheel. Shipping to US only. Contact Jeff for shipping outside the US.