“Someone told me long ago
There’s a calm before the storm” Have You Ever Seen the Rain, Creedence Clearwater Revival
“Man, individually and in mass, can usually tolerate only three attempts.
The typical salesman, after ringing three doorbells and getting turned down, will go to the movies.
The typical fighter, after being knocked down three times, stays down.
So with the market. Short-term, intermediate-term and long-term moves usually comprice three well-defined steps.” Edson Gould
I posted this daily chart of the SPY on the Hit and Run Private Twitter (X) Feed late Tuesday showing the Rising Wedge from the August low.

The SPY’s Rising Wedge is a Stem Pattern in Elliott Wave terms.
What that means is that the 3rd wave is not the largest.
In Elliott Wave Theory the 3rd wave is usually the largest, but it can never be the smallest.
In the above advance, the Wave 1 is the rally from August 5th to August 23rd.
The Wave 2 correction is the pullback into September 6th.
Wave 3 is the move from September 11th to September 19th.
A small A B C pullback defined the corrective Wave 4 into October 2nd when the SPY turned its 3 Day Chart down.
If Wave 3 cannot be the smallest wave, it means the current Wave 5 cannot be larger than Wave 3’s 33 points.
Wave 5 started at 565. By definition that means that Wave 5 cannot exceed 598.
The SPY can drive to 598 (near 6000 SPX) however the bearish Rising Wedge will be satisfied by a push to 581 (5810).
So, while theoretically the SPY could get to 598/6000 SPX…that’s become the number du year on The Street: ask little children in Katmandu where the market is going and they’ll say “6000”.
My point is that while we all understand the market can do anything, we must be mindful of the quaint fact that what everyone knows on Wall Street is seldom worth knowing .
The aforesaid bearish Rising Wedge is in the context of a Low to Low to High cycle.
Allow me to explain.
We got a major low on October 13th, 2022.
One year later we got another major low on October 27th.
The Cycle calls for a high in October 2024.
What’s the price?

Notice the top rail of the trend channel is in the current region (allowing somewhat higher prices) along with a backtest of the broken Bottoms Line (magenta) from October 2023.
Again, The Cycle calls for a high in October 2024.
Split the difference between the dates of Oct 2022 low and the Oct 2023 low and you get October 20th. That’s an idealized time frame. But it encompasses the week in which the air came out of two of the biggest blow-offs of all-time: October 24th, 1929 and October 19th, 1987.
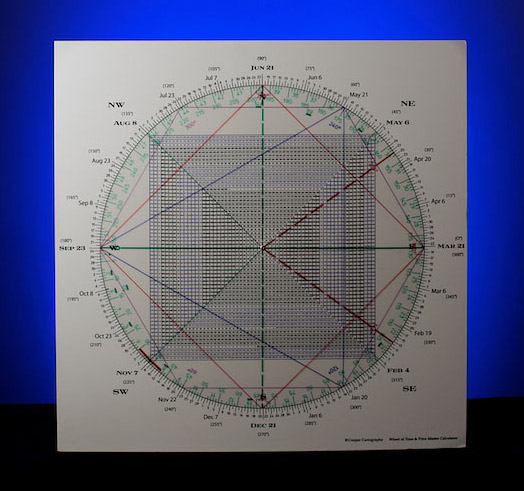
It’s interesting that this time frame is opposition 581 on the Square of 9 Wheel.

At the same time 578 squares out with the big August 5th low.


Square of 9 Wheel
Purchase your own Square of 9 Wheel. Shipping to US only. Contact Jeff for shipping outside the US.
In sum, a monthly SPY shows a Measured Move from the 2020 low projects to 609 (6090).
Anything is possible, but they’re always higher to buy when the market is locked and loaded for bull.
6000 may be the hook that keeps players psychologically y locked in way past the top.

September stinks historically. October scares historically.
Not this September and not this October…so far.
Wouldn’t it be fittingly perverse of Mr. Market to strike a record high in The Cycle in October.
