“When your outside’s in (inside out)
And your downside’s up (upside down)
Yeah, your upside’s right (right side up)
Yeah, don’t it make you wanna twist and shout
When you’re inside out?” Inside Out, The Travelling Wilburys
They say the biggest rallies are in the midst of bear markets.
By extension then it is conceptually correct notion that really big rallies come in the middle of crashes.
We think we have memories, but price action has a way of fading over time.
That’s what charts are for
So let’s take a look at the last two downturns, 2020 and 2022.
2020 took the elevator down, 2022 took the escalator down.
Below is the 2020 Covid Crash
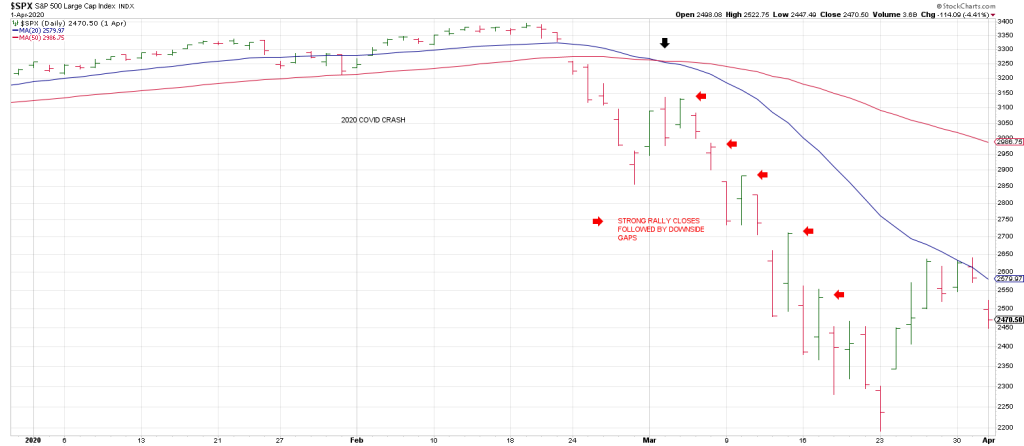
There are three things I want to draw your attention to:
- The first arrow is March 4th. Notice how the 3 Day Chart failed to turn up by a fraction that day.
- The prior session, March 3rd, ties to a 20/50 day moving average Bowtie…where the 20 and 50 DMA’s ‘pinch’.
- The SPX closed on its high on March 4th,2020. The index gapped down with authority the next day.
Since the SPX missed turning its 3 Day Chart up on March 4th, it was in the Minus One/Plus Two Sell position.
Interestingly March 4th, 2020 was a Squeeze Play—the prior session was a complete downside reversal with March 4thsqueezing into the bell to close at session highs.
On Friday March 6th, the SPX closes on its highs. The following Monday, it gaps down.
Looks bad right? But the next day, March 10th, the index closes on session highs.
Rinse on, rinse off. Wax on, wax off.
Naturally, the market changes directions again with a gap down on March 11th.
We get downside follow thru on March 12th with the SPX closing right on its low.
Looks horrible right?
The next day, Friday the 13th, the SPX surges, closing on session highs at 2711.
On Monday they put the hurt on with the SPX gapping down to Friday’s lows at 2508.
That’s a 200 point gap. That’s more than a 7% gap.
In today’s market that equates to a 370 point GAP.
The pit bull wasn’t done shredding the Rag Doll market: On Tuesday March 17th, the SPX rallies from the getgo, close near session highs.
The same DNA continues: remarkably, the SPX gaps down the next day and extends to new lows for the move.
I know I’ve seen this stop, start, stop, start action before.
It’s Jerry Lewis driving in the Errand Boy.
Accelerator, brake, accelerator, brake.
Something was really wrong with the market.
Something is really wrong with the market.
It’s so wrong that it’s “controlled”.
It’s The Hand trying to tamp the brakes on the crashing market to avoid a cataclysim.
In the slow-motion crash of 2022, the biggest rallies were in the midst of the downtrend.
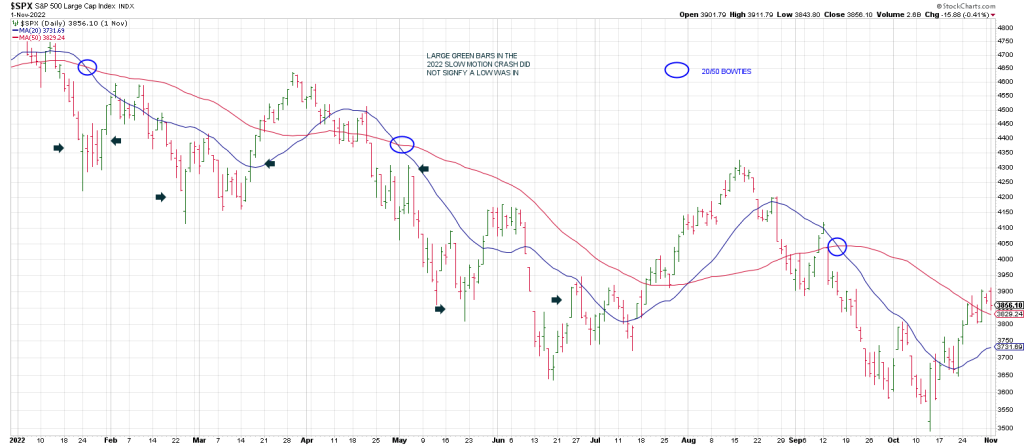
Look at the big green bars.
In sum, for the third time this week the market has tested the region just above SPX 5300.
Like March 4th, 2020, the SPX missed turning its 3 Day Chart up by the slimmest of margins.
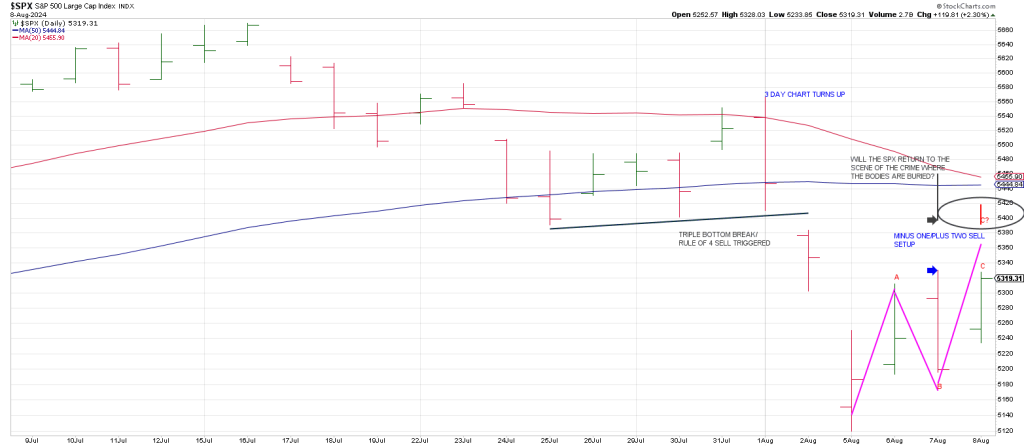
Has the SPX completed an A B C retrace with Thursday’s rally?
A up into Tuesday, B down into Wednesday and C up on Thursday.
The 3 Day Chart cannot turn up today. Because we will not have 3 CONSECUTIVE higher daily highs today even if the index eclipses Thursday’s highs.
That said we did get a close above the 529/530 (5290/5300) square which theoretically opens the door higher.
To where?
Well, our old friend 5373 is 360 degrees down from the all-time high
As you can see on the above dailies, the SPX held that region which tied to the 50 day MA throughout late July.
There are 3 distinct low closes below the 50 day line that hold just above the key 5373 region.
All reflected closes near session lows, but miraculously held above 5373..until it didn’t
Mr. Market knew that breakage below this 360 degree zone down from high would signal lower.
‘They’ were trying to save the baby.
So we know that 5373 is 360 degrees down from high.
This ties to Phil D Gap from August 2nd.
This region ties closely to a 50% retrace of the range down from high.
That 50% retrace is 5394.50.
Let’s look at the Principle of Squares up from the low.
From Monday’s 5119 low:
90 degrees up is 5119
180 degrees up is 5263
270 degrees up is 5336…that’s a fraction above Thursday’s high.
Is it possible an extension to 5336 elicits a pullback to 5263?
This ties to the 20 hour moving average.
360 degrees up from 5119 is 5409.
There is an interesting convergence between 5409 and a 50 retrace at 5394.
As well if the SPX satisfies a drive toward the 5400 level, it will be perpetuate a backtest of the 50 day moving average in tandem with Phil D Gap from August 2nd…with the 20 and 50 dma pinching.
It’s reminiscent of early March and the 20 and 50 day moving average ‘Bowtie’
It’s a ‘drive-by’ not even Jerry Lewis could mess up.