Over the years, Jeff has accurately predicted major market ebbs and flows. He’s been spot-on with everything from the crash of March 2020, to the meteoric rise in precious metals prices in 2024.
← Back to Powerful Market Insights“What’s in the box?” – The movie, Seven
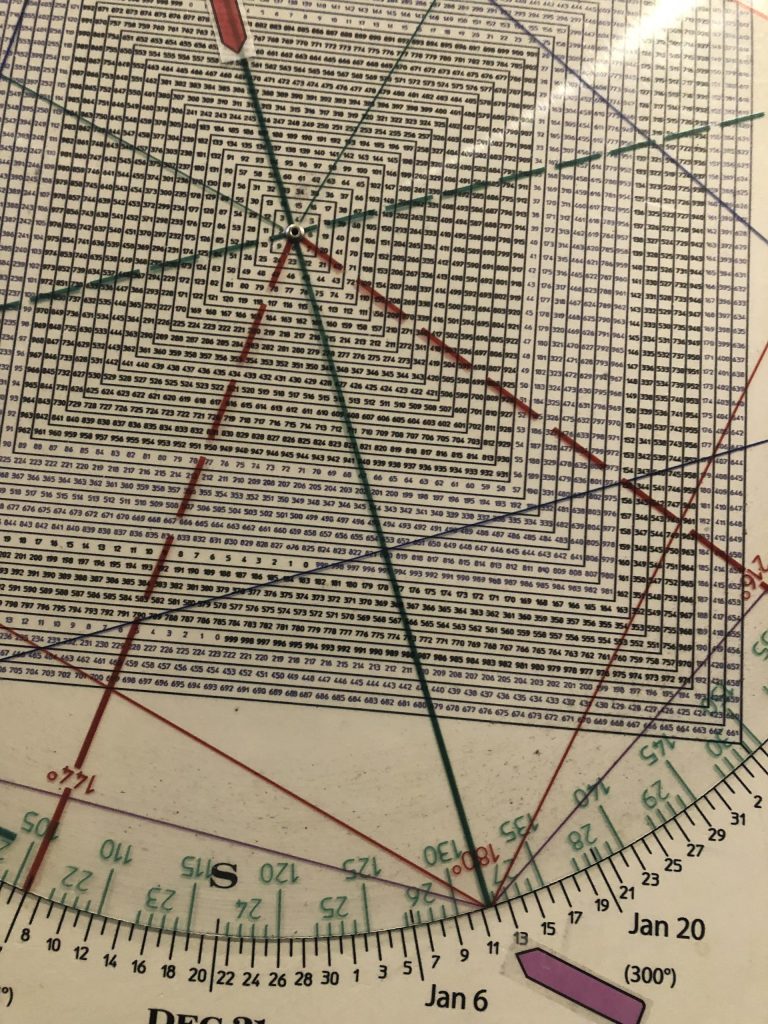
As the bell rings on 2022, the bull will be 4686 days counting from the March 6, 2009 low. Rounding off and moving the decimal point to work with the Square of 9 Time & Price Calculator gives 469.
Breakage back below 469 (which ties to the breakout area over the last two months) opens the door to lower prices and is at least an initial indication of a false breakout.
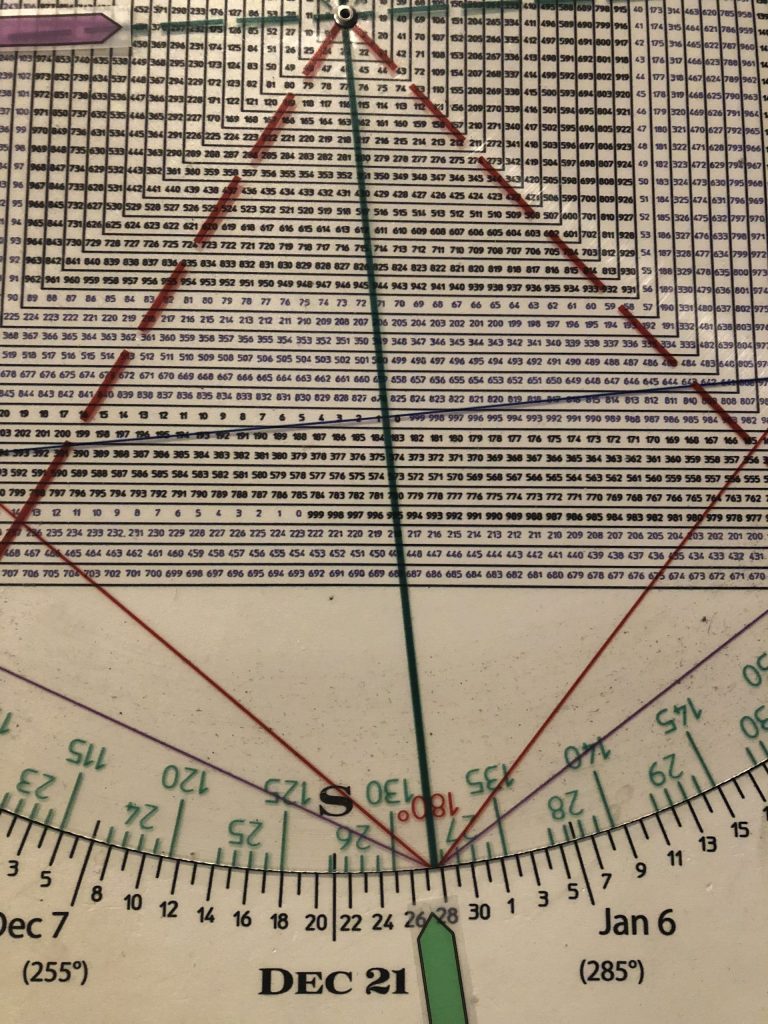
This is also important because 469 is 180 degrees straight across and opposite January 11.
That was the false breakout top in in 1973 prior to a devastating two year bear market which punctuated a sideways decade of the 1970s.

Red 469
Purple Jan 11
I bring this up because legendary trader WD Gann wrote that 7 is the fatal number.
January 2022 will be 7 squared, or 49 years from the 1973 top.
In the same way Gann’s Panic Window opened 49 days after the September 3, 1929 top defining a crash.
Ditto the Panic Window opened 49 days after the August 25 top in 1987, defining another horrific crash.
Likewise, the 1999 was 70 YEARS from the 1929 top.
The NAZ topped a few months into 2000 and declined around 86%… mirror the debacle after the 1929 top into 1932.
The SPX has broken out over a flat line struck since late November, but I can’t help but wonder if the SPX is mirroring the false breakout in November of IWM.
Once IWM broke back below the “pivot,” the breakout point of 229 it dropped quickly to 209.
The breakout pivot on the SPX is around 4710.
Breakage back below 4710 that is sustained suggests a false breakout.
Let’s take a look at the SPY. It set an ATH on November 22 at 473.50, reversing that day to leave a Key Reversal Day and careening nearly 25 points lower in 6 to 7 days.
On Monday, the SPY finally struck a new ATH. It followed through on Tuesday before tailing off from a new ATH of 478.80.
Rounding gives 479.
Checking my Square of 9 Calculator shows that 480 is 180 degrees straight across and opposition November 22.
This is important because November 22 is when whiplash began.
It is important because within the context of the possible SPY Megaphone Top pattern (a 5 point pattern of higher highs and lower lows), time points to price and price points to time.

480 red
Nov 22 blue
In other words, the takeaway is that the Nov 22 turning point/reversal is flagging the 480 region as pivotal.
Is 479 close enough?
Conclusion. Markets saw a stick save a week ago Monday at the 4500 SPX region. If the index had breached 4500, no doubt we’d have seen another Christmas Crash like 2018. The SPX was well on its way to its 200 day moving average.
My take is the Fed is scared to death of the market. Powell certainly didn’t want another Christmas Crash on his watch.
This is why they’ve been building a war chest with reverse repos. They were doing so hand over fist by the way in the fall of 2019 and it would not be surprising if they already had the Covid news on their radar at the time.
But I digress. The Fed is scared of the market because at least in 2018 they had the ability to cut rates as they had raised them before.
Now they have nothing to cut. As well, they have inflation to contend with.
This is not 2018.
The Fed is afraid.
And, the market is afraid of the Fed.
Consequently, since late November, it’s been the Whiplash Express.
The Fed is afraid and the market is afraid.
I’m afraid fear is going to run rampant in the first quarter of 2022.
That said, if the market pulls back and holds support in the 4710 to 4740 region and turns up with authority, it may shoot the moon to 4900 (70 squared) going into the 49th anniversary of the 1973 pre-crash fakeout/breakout.
