Stocks prices never move in isolation. Markets are always forward-looking, with “smart money” subtly influencing key sector trends long before significant market moves.
Defensive stocks, in particular, often send early warnings, sometimes weeks or months, before a bear market takes hold or is widely acknowledged.
Due to their defensive characteristics, specific sectors are naturally more resilient during economic downturns. Astute money managers detect emerging shifts in the financial landscape and begin reallocating capital, rotating from once sector to another. This movement into defensive sectors serves as a valuable signal of a change in trend.
You have to understand that money managers must be at least 90% invested. That is their mandate. They don’t go to 90% cash at times like you or me. Conversely, unless they are hedge funds, they do not short like you or me.
They shift/rotate into more defensive “risk-off” sectors such as Consumer Staples, Healthcare and Utilities.
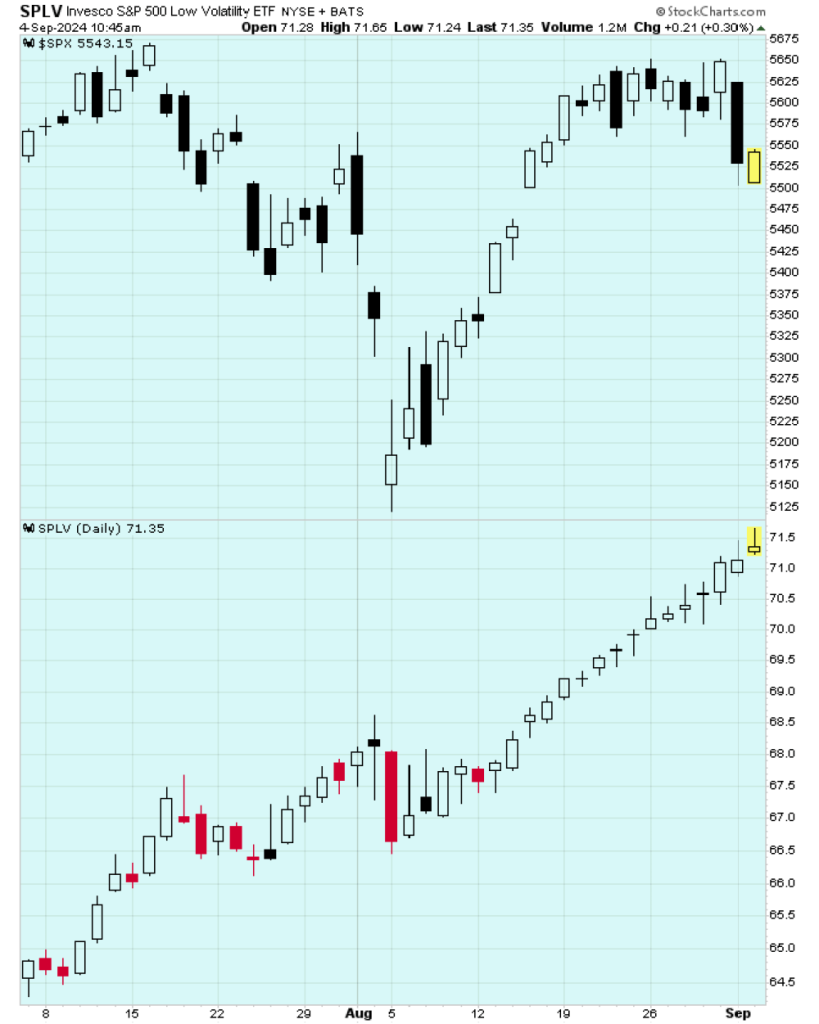
Last week we showed a chart of one singular security that bundles many defensive leaders into one vehicle: the Invesco S&P 500 Low Volatility ETF (SPLV).
2015 and 2020 offer clear examples of what typically follows a period of significant outperformance by SPLV, serving as a proxy for risk-off assets.
In the summer of 2015 risk off issues significantly outperformed the SPX through July and August.
SPLY provided a clear warning for those paying attention.
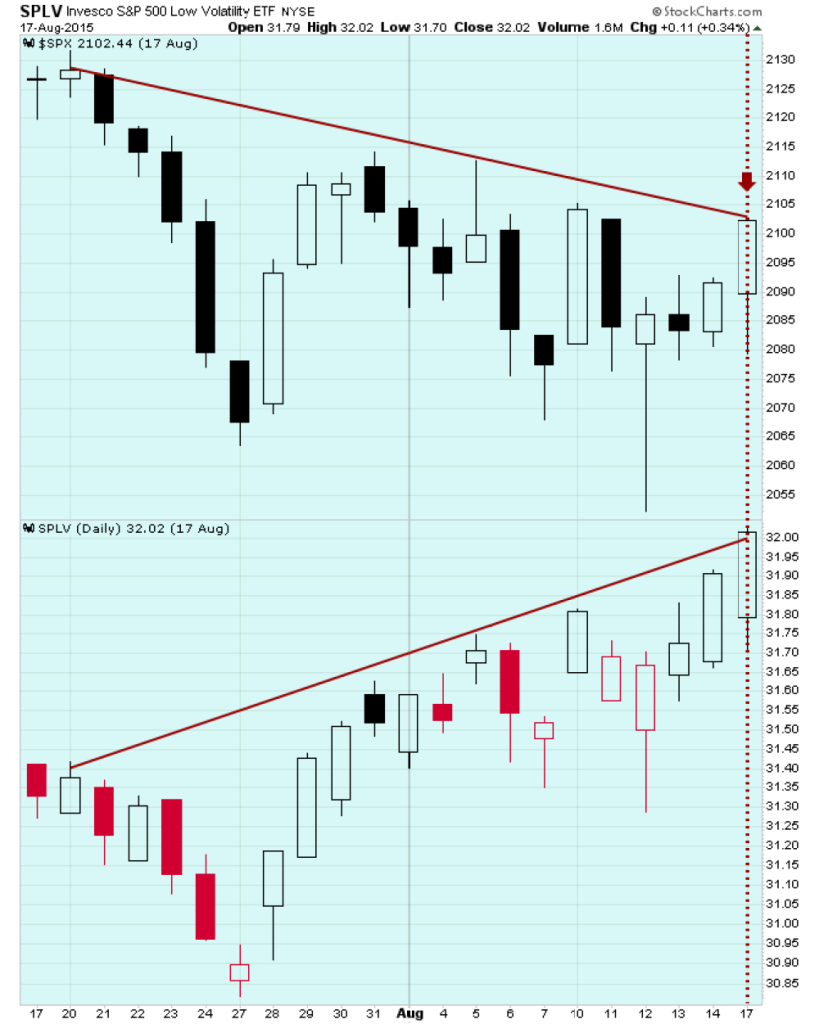
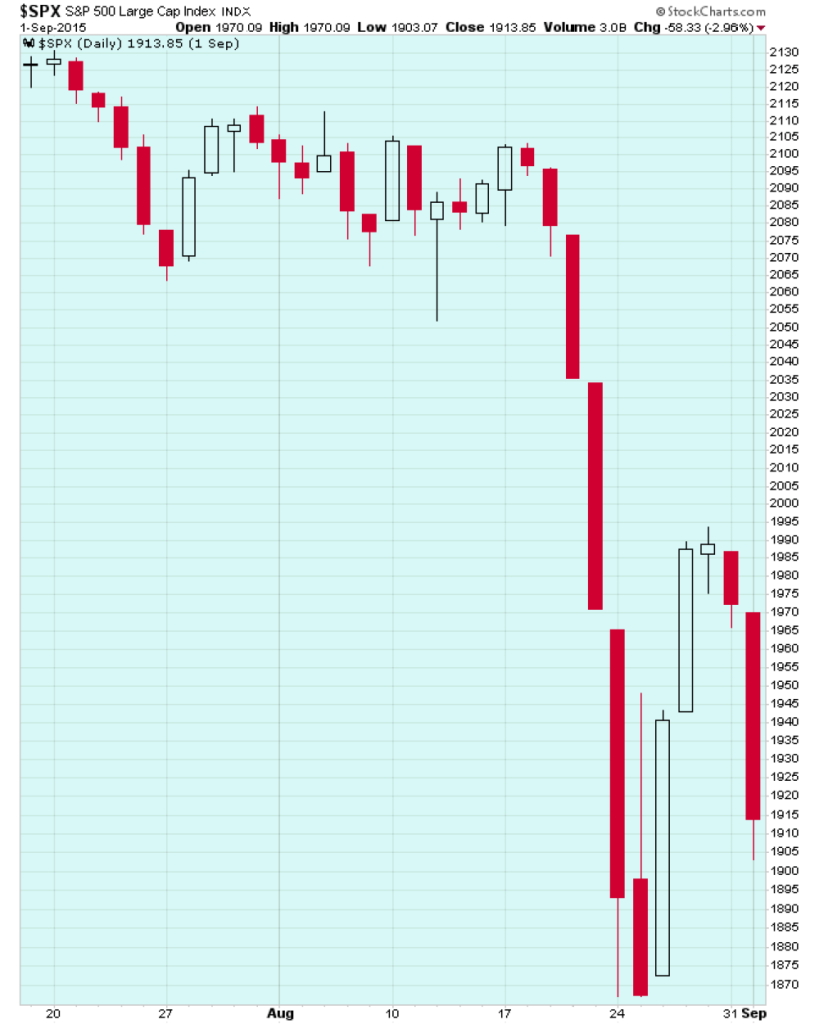
As we approached Labor Day, markets dramatically reflected SPLV’s message, revealing the underlying fragility that only a few had anticipated. The subsequent market drop was a rude awakening for those who ignored or were not aware of SPLV’s early warning.
We witnessed a similar scenario four years later approaching 2020 as the markets neared a new decade. Once again, risk-off securities like SPLV delivered a clear warning.
Unbeknownst to nearly everyone, the Covid crisis was looming. Risk-off assets however picked up tell -tale buying.
SPLV’s warning manifested at that time in what became known as the Covid Crash.
It was a harsh reminder of the MARKET’S ABILITY TO SENSE IMPENDING CRISES.
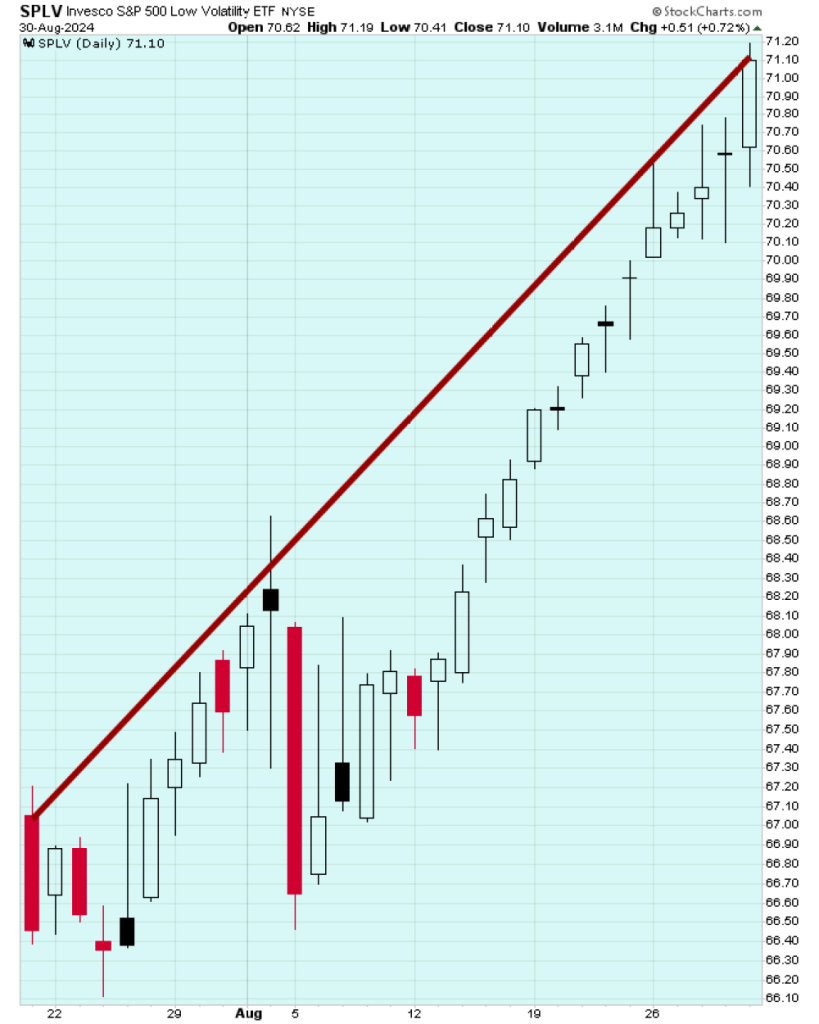
Now another 4 years later we find ourselves in a similar position. This summer’s performance highlights a significant and unprecedented event: SPLV has recorded 16 consecutive sessions of gains, setting a record for the longest streak of advancing sessions in history for any security I’ve ever seen.
Actually, I believe the record was broken at 14 consecutive issues.
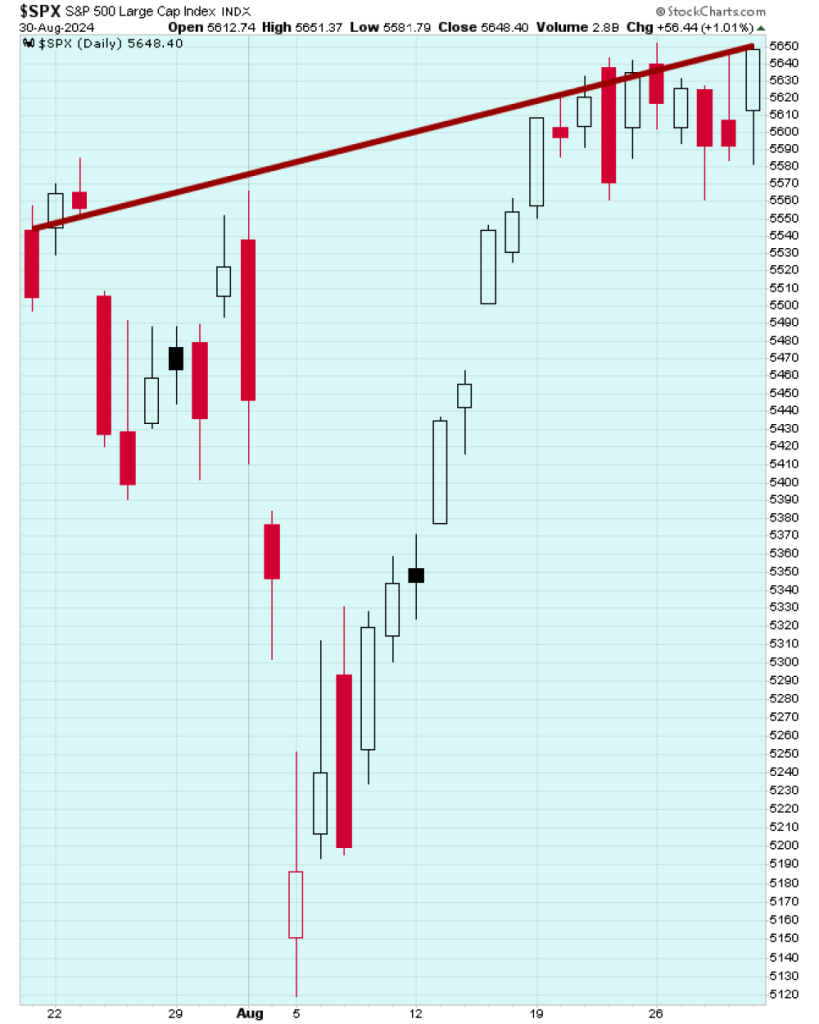
The chart below is SPLV thru August 30.
SPX over 6 weeks thru last Friday
I know what your question is. No. SPLV didn’t exist in the 20th century, preventing direct historical comparisons of some of the periods we’ve been alluding to recently.
However we can approximate its significance. Current performance trends suggest that this ongoing outperformance is a rare event—likely a “100-year occurrence.”
This is in keeping with the notion of a Super Cycle Top.
This estimation reflects a profound deviation from typical market behavior, indicating that this level of risk aversion hasn’t been seen in generations.
The extraordinary upward trend in a defensive asset like SPLV reinforces the idea that we may be witnessing a significant shift in market dynamics.
It is a powerful signal for traders indicating that the market’s underlying sentiment is becoming increasingly risk-adverse.
This is personified by the action of NVDA against the DJIA, or the QQQ against the SPX.
We can’t be sure what event is on the horizon. But just like in January and February 2020 when we had a Primary High followed by a Secondary High, the markets are sensing powerful shifts in economic direction. And, they are warning us.
It follows suit with the structure of the market and the cycles we’ve been pointing to.
As well it is borne out by the message of the Square of 9 Wheel in a litany of Time/Price synchronicities.
For smart traders the “why” is largely irrelevant. The critical question is, “When?”
The answer is “now.” Now pertains to the time period from last April thru this coming April.
Remember April marked the Great American Eclipse and the low from which a blow-off occurred mirroring the 13 week blow-offs in both 1929 and 1987.
It is debatable whether we are following those paths directly or whether the market is forging a different pattern here.
I say that because while the SPX is in the heart of the Gann Panic Window right now counting from July 16th, QQQ topped 6 days earlier on July 10th.
As well the DJIA struck a record high on August 30th.
Be that as it may, the market may be playing out in a 90 day/degree decline like the July-October 1990 debacle.
It is also possible that a 90 day/degree pattern like July/October 2007 is on the table where a nominal new high was struck on October 11, 2007 (above the July 2007 peak).
This week should give us a lot of information.
Be that as it may, I expect lower prices here and after the FOMC on September 18th.
As offered yesterday, a test of the August low looks on deck —if 5520 fails.
Remember this is 180 degrees down from the SPX ATH.
The index violated 5520 on a brutal sell day on Tuesday to kick off September and then traced out a choppy session yesterday with the SPX closing precisely at 5520.
You can’t make this stuff up.
As well the SPX is attempting to hold its 50 day moving average this week.
The 50 and 20 day are forming a Bowtie at 5520 region where they are testing the open gap from August 15th.
This is a critical level for all the reasons above but also because it is where the rebound from the August 5th low signaled it was going to test the highs—at least.
This was signaled by the Momentum Gap on August 15th above the 50 day ma.
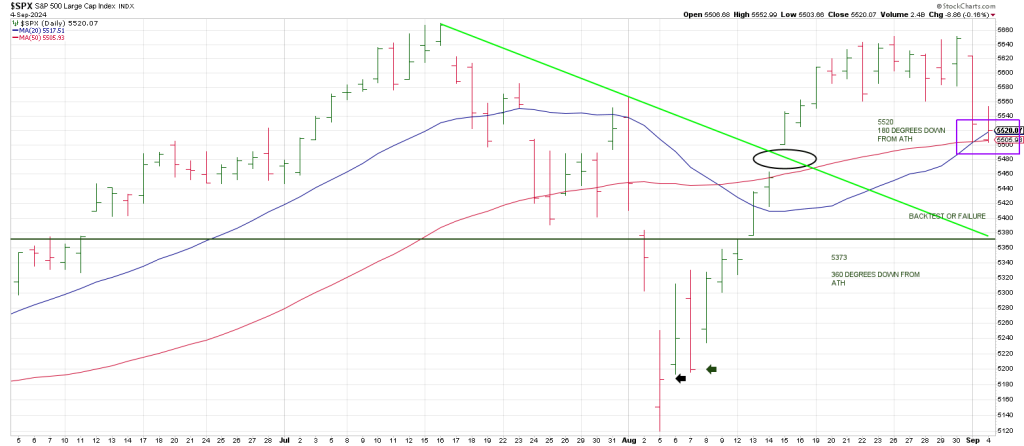
Downside follow thru below 5520 that continues thru the open gap at 5463 opens the door to a full 360 degree decline to 5373.
Notably, 5394 is the mid-point of the July-August range.
Interestingly a 540 degree cube-out down from the SPX ATH is 5227.
This equates to a test of the August 5th low because the double low closes on 8/5 and 8/7 were 5186 and 5189 respectively.
In sum, as discussed above, investment managers have been shifting funds from risk-on assets to more defensive, risk-off vehicles.
Even the slightest indication of weakening employment data has triggered accelerated selling in economically sensitive assets recently—further fueling the movement into those “safe havens.”
With this theme prevailing , it will be interesting to see how markets respond to Thursday’s jobless claims and ADP jobs estimates, followed by the BLS employment report on Friday morning.
Something is ready to give.