“Keep on running, keep on hiding
One fine day I’m gonnna be the one” Keep On Running, The Spenser Davis Group
The DJIA struck a high in early February 1929 and consolidated correcting into late March.
Sound familiar.
The correction double bottomed in late May and exploded higher where it consolidated again into late July.
Below is a daily DJIA from mid-July 1929.
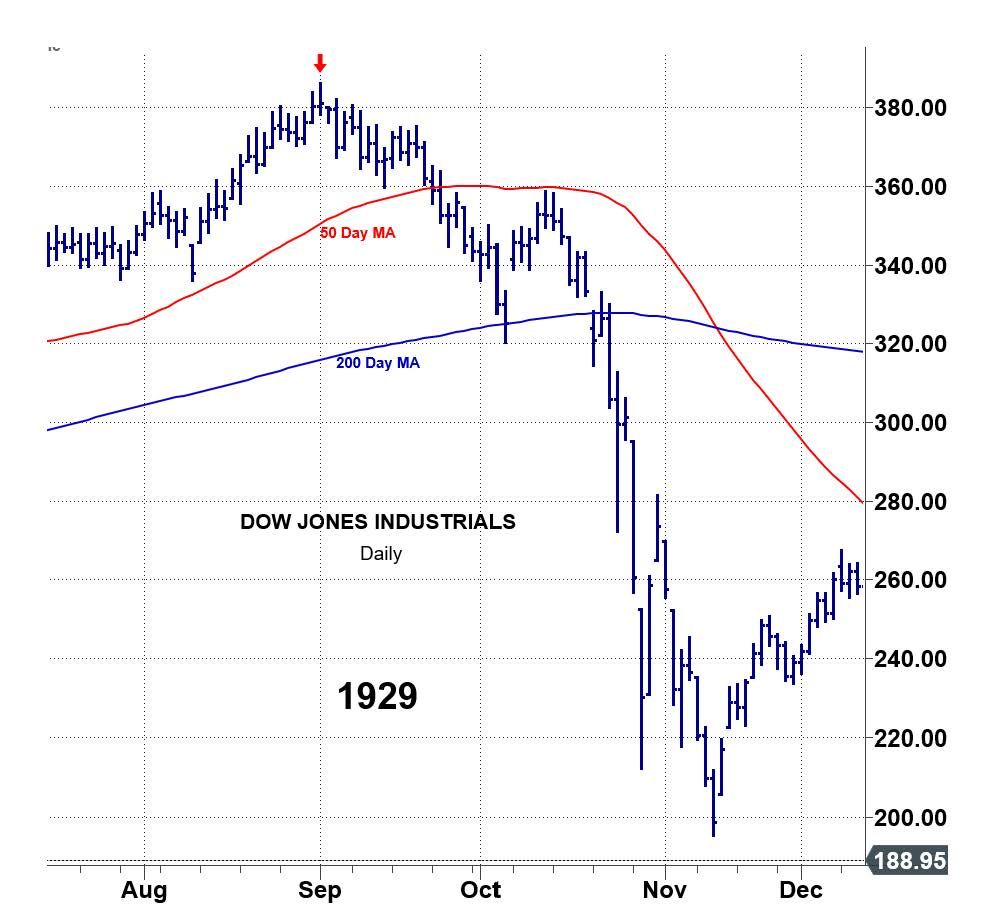
I didn’t show the liftoff from May because I want to zoom in on the little double bottom—
July 29 and August 9.
That “2 bar double bottom” is what I call a Flamingo Low for obvious reasons.
They put in two stick legs defining a low prior to a lift-off.
In this case the lift off made history.
It was 16 trading days—3 weeks (markets really do play out in threes) to a top that would not be eclipsed for 25 years.
Note that the August 9 low was a Breakaway Gap that morphed into a one day Island Bottom.
In sum the DJIA did a head fake before it popped its cork, before the Champagne Run.
Allow me to explain. The DJIA broke just below flat line support on July 20 (the first Flamingo Low).
Then the DJIA broke out above the Line Formation for two days.
The third day it tailed off leaving a little Lizard sell signal (August 5).
The ensuing pullback broke back below the top of the Line Formation—a potentially bearish pattern, a false breakout.
However, the sell-off found support as it tested the prior low from July 29th as it flirted with its 50 day moving average.
The next session the DJIA gapped up leaving a one-day Island Bottom.
The rest was history, literally.
The point is there was a double head fake—a breakout, a breakdown and then a run for the roses.
Now I want to walk through how the market telegraphed a turn down.
It didn’t announce the magnitude, but given the advance over the previous 8 years, you didn’t have to be a rocket surgeon to be concerned that a 15% rip in 16 trading days might be a serial selling climax.
Few anticipated what would follow. But if you know how to listen to the language of Mr. Market, you will see that he doesn’t always speak in tongues
While Mr. Market’s Job Number One is to deceive, he enjoys leaving clues at the scene of the crime.
Mr. Market may be a liar but he’s a sportsman.
On September 23, THREE weeks after the Sept 3 top, the DJIA broke below its 50 day moving average.
Not a big deal but it hadn’t tested the 50 DMA since reclaiming it in June, THREE months prior.
The drop below the 50 day line turned the 3 Day Chart down and the DJIA kept on dropping.
Following a powerful rally, the normal expectation would be that a turndown in the 3 Day Chart following a stunning display of strength would mark a low.
It did not.
First warning sign.
The thing is the DJIA didn’t just test its 50 dma, it kept on going.
In so doing it snapped the Flamingo Low that perpetuated a runaway move.
This should have raised a speculators suspicions.
Breakage below the 50 day elicited a drop to the 200 DMA.
The 200 DMA had not been tested for over a year, since June 1928.
Theoretically, no cause for alarm.
Yet.
The DJIA Pinochioed its 200 DMA, closing right on it.
The next session the DJIA gapped up, closing on its high.
You can almost hear the roar of the crowd chomping at the bit for new highs.
The rally off the 200 day moving average delivered a picture perfect backtest of the 50 day moving average.
Interestingly the 3 Day Chart never turned back up.
The signal reversal bar on October 11 (interesting anniversary date) led to another test of the 200 day moving average.
However, notice that this time there was a GAP BELOW THE 200 DMA. That gap occurred on October 21st.
The DJIA kiss Phil D Gap on October 22 and CLOSED BACK BELOW THE 200 DMA.
Now we have two confirming closes below the 200 DMA.
The next day was October 23 and the first of 5 days that shook the world.
The heart and soul of the Great Crash was FIVE days. That’s it.
5 days changed many lives—including the life of the country.
In 5 days the DJIA waterfalled from 333 to 212 on the infamous October 29.
37% in 5 days.
In todays market that represents a plunge to 4064.
That ties to the October 2023 low.
That’s where the SPX began a vertical ascent, interrupted only by this Spring’s sell-off.
There’s some logic to the idea that a major crash would unwind to where it started.
Clearly below the 4800 level—the April 2025 test of the January 2022 peak—opens the door
The DJIA went somewhat lower into November 13 following a huge two day rally.
The Mother of Minus One/Plus Two Sell setups.
That said the lower low on November 13 was 195 compared to the October 29th low of 212.
The moving averages did a great job steering some out of harms way.
Except for one thing: there were no moving averages then.
There were no computers.
No one was doing the plotting by hand—except maybe Jesse Livermore.
Stunningly, the DJIA behaved precisely as if the 50 and 200 DMA’s were calling the shots.
This proves the market is deterministic.
Not even those who say that in the modern market the 50 and 200 day moving averages are self-fulfilling can deny the stunning display of those non-existence moving averages in 1929.
The matrix lives.
Today’s SPX is an extraordinary analogue to the above pattern from 1929.
So far.
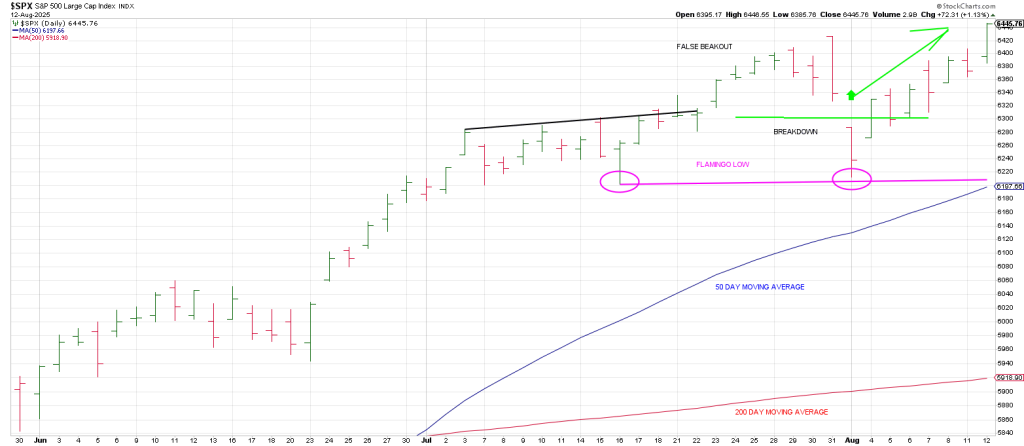
The first Flamingo Low was July 16.
We got a breakout that Jackknifed back below a Line Formation.
The SPX pulled back to the same region as July 15…leaving a Breakaway Gap in the process on August 1st.
Flamingo Low #2.
The SPX left Phil D Gap in the dust on August 4th on its way to clearing the July 31st Key Reversal Day yesterday.
Look familiar.
If the analogue rhymes we could extend for another 9 trading days to the 6900 region.
That takes us to the August 24 anniversary of the 1987 pre-crash high.
Interestingly, the advance into the 1929 top was 8 years.
Currently the market has advanced 16 years from 2009 to 2005.
Whenever this top is struck, it may be a degree higher than that of 1929.