“Good and bad
I define these terms
Quite clear, no doubt,
Somehow” My Back Pages, Bob Dylan
“You can’t go back and change the beginning,
But you can start where you are
And change the ending.” C.S. Lewis
Jesse Livermore’s most famous campaign, the 1929 bear market that generated roughly $100 million in profits (about $1.3 billion in today’s dollars) began with a market setup that closely resembles conditions as we enter 2026.
The critical signal for Livermore was never the averages themselves, but leadership. In 1929, the dominant stocks of the era began to stall and roll over while the broader market continued to grind to marginal new highs. That loss of leadership was the earlies and most important evidence that the bull market’s internal engine was sputtering.
The same condition is now unmistakable. Throughout 2024 and much of 2025, the Magnificent Seven carried the SPX and NDX higher by sheer capitalization weight, obscuring persistent deterioration beneath the surface.
That pillar of support is now fracturing.
Using MAGS (the Mag7 ETF) as a proxy, the former leaders appear to have entered a downtrend in the final two months of 2025.
It marks the first time this DECADE that market leadership has ceased to lead higher and has begun to lead lower.
Let’s take a look.
A daily MAGS shows they “overbalanced” price in the correction from their October 29 record high to their November 21 low.
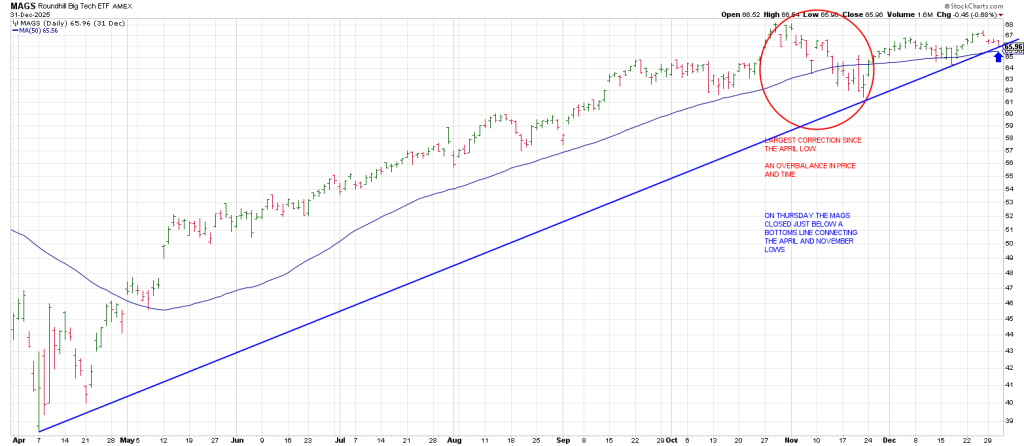
An overbalance is the largest correction of an advance in progress.
It is a warning of a shift in trend.
As you can see the Q 4 correction was larger by bar than any pullback since the April low.
In reality there was hardly any correction from April to the end of October in the MAGS.
As well, following the Oct 29 high, the MAGS violated their 50 day moving average for the first time since the April low.
The normal expectation after such a persistent 6 month rally would be for a test of the high…a Secondary High.
Drilling down to Q 4 it looks like MAGS satisfied a Secondary High on a push into Phil D Gap on December 26.
At the same time MAGS “broke out” of a triangle on October 22 but bearishly gapped back into the triangle on Tuesday, Dec 30.
This was the second consecutive gap down in a period where the Santa Rally usually shows up.
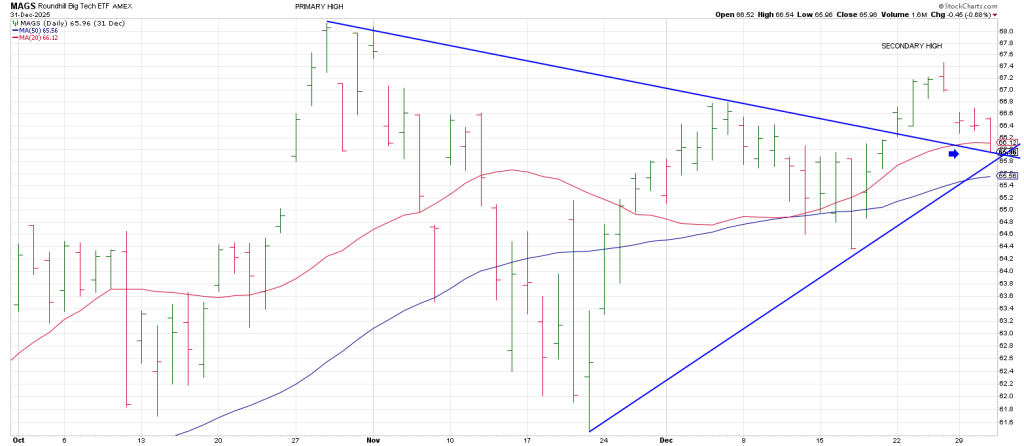
If you recall recently warned of the potential for a Triangle Pendulum—a breakout of a triangle followed quickly by a reversal back into the triangle which is a warning. The Triangle Pendulum signal is produced by a failure back below the bottom of the triangle.
This occurred on Tuesday. On Wednesday the MAGS followed thru unequivocally below the bottom of the triangle closing below its 50 dma.
It looks set for a close below the 50 dma today on the Friday Weekly Closing basis.
In sum it looks like we have a false breakout confirmed by a Triangle Pendulum sell signal.
Wednesday’s weakness was in keeping with the Roadmap that was looking for a late Rug Pull. The drop showed up a tad later that the idealized time-frame.
A weekly MAGS mirrors the QQQ.
Right off the top the MAGS turns its 3 Week Chart down for the first time since the April low.
This in and of itself is a warning coming right off the all-time high.
Keep in mind the MAGS never traced out TWO consecutive lower weekly lows off the April low…and then they carved out THREE consecutive weekly lower lows into the week of November 17th.
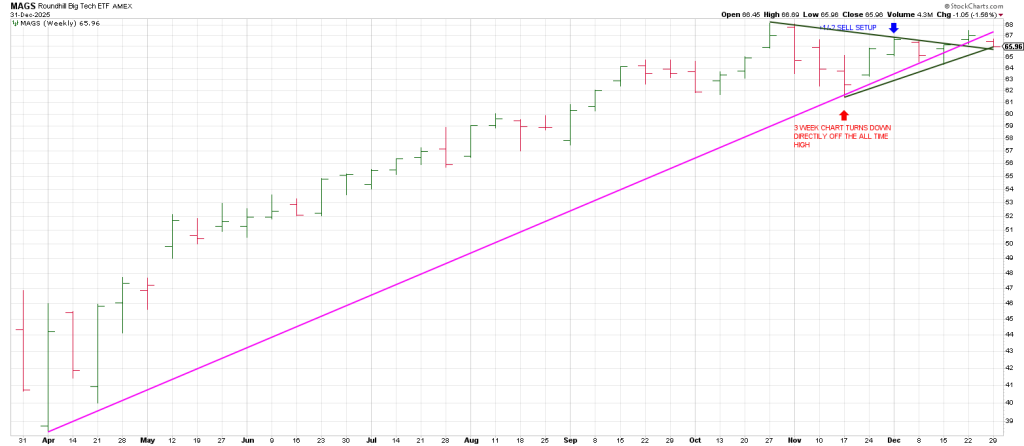
That was a well-defined buy setup as it was also the first test of the 20 week moving average since the low producing a Holy Grail buy setup.
Following the November low, the MAGS traced out two consecutive higher weekly highs for a weekly Minus One/Plus Two sell setup.
It produced a pullback…but not a rollover per se.
That said last week the MAGS turned their weeklies up coincident with the “breakout” from the triangle…and died.
This is a bearish complexion.
Trade back below the “circled” 3 Week Chart low at 62.36 and the 20 week moving average at 64.71 are further warning signals of generals sounding an alarm on the overall market for 2026….at least for the 1st quarter.
It will be interesting to see what January 29 time-frame brings being 90 days/degrees from the October 29 all-time high.
As well January 7, is 270 days/degrees from the April 2025 low.
From the MAGS 69 high, 90 degrees down is 61 which ties closely to the November low.
It would not be surprising to see an undercut of the November low and a rally attempt.
If so, the nature and structure of such a potential rally, be it 3 corrective (bearish) waves, or 5 impulsive (bullish) waves will be important to observe.
180 degrees down from the MAGS 69 high is 53 which entails an undercut of the 200 day moving average (currently at 57).
270 degrees down is 46.
360 degrees down is 40, the April low.
Essentially the MAGS rallied 360 degrees in roughly 180 days/degrees.
Cycles indicate this is something more than a correction/consolidation, with the breakage of the 2 month triangle.
Today’s Roadmap looks bullish into 10:45 with a possible intervening short pullback from 10:15 to 10:30.
From 10:45 the market starts to pullback, accelerating at 11:15 and dropping into 1:00.
From 1:00 the indication is a rally into 2:00 and flat into the close.
There are two possible Inversion Pivots.
The first at 10:15.
The second at 2:00.
Today is an OpEx, so the drop from a 11:00 peak into a 1:00 low followed by a rally could be just what the Market Maker Doctors ordered.
It could also offer us a two nice ODTE plays IF it appears Mr. Roadmap is dialed in today.
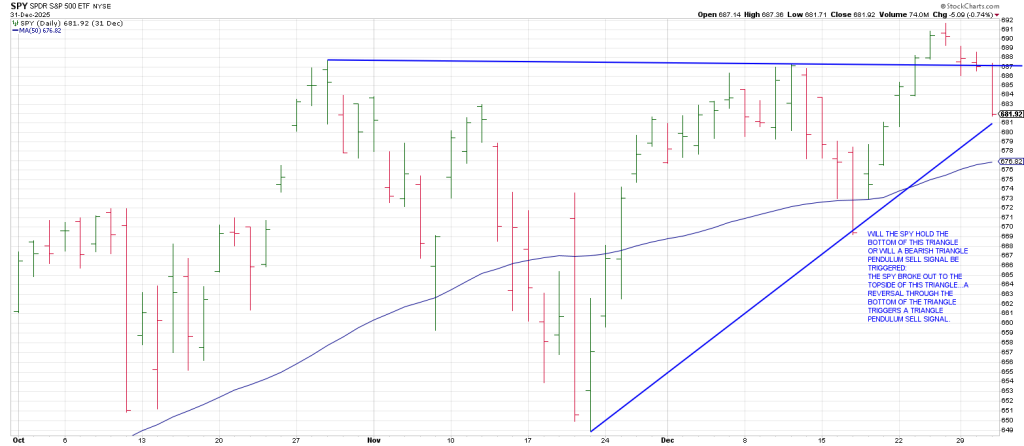
In sum, the SPY has dropped to the bottom of its triangle.
This is where we get a rebound if one is on the table.
The nature of the rebound (be it corrective or impulsive) will tell us whether the SPX is on a trajectory to the 7000-7100 square-out region.
700 squares the SPY April 482 low.
710 vectors 348, the 2022 low and as it happens aligns with 386, the DJIA high in 1929.
They all point to January 15.
The upside pivot is 687.50.
Silver
On the night of Sunday, December 29, 2025 silver traded to $84, just $1.00 shy of the Square of 9 projection to $85.
To recap from the silvers major 27.80 low 85 is two cycles of 360 degrees up.
At 84, silver was ripe for reversal not only satisfying a major square-out within the context of a vertical melt-up but was 100% above its 200 day moving average.
The silver top in February 1980 perpetuated a 20% drop in the DJIA in 2 months.
The silver top in April 2011 saw a 20% drop in 4 months.
The September 2020 top in silver correlated to a 10% decline in 1 month.
While SLV recovered on Tuesday, it gapped down on Wednesday closing at a low for the move off the all-time high and leaving a large Island Top.
For the moment caution is warranted…it has not even turned its Weekly Swing Chart down. Let’s see what happens if, ideally, it gives us two consecutive weekly lower lows.. It may setup for a buying opportunity which we will be monitoring closely.