“But all the clocks in the city
Began to whirr and chime:
‘O let not Time deceive you,
You cannot conquer Time.” W.H. Auden, As I Walked Out One Evening
Cycles are due to exert downside pressure starting in July 2024.
The price structure of the SPX from the slow-motion car crash low in October 2022 shows a culminating 5 waves.
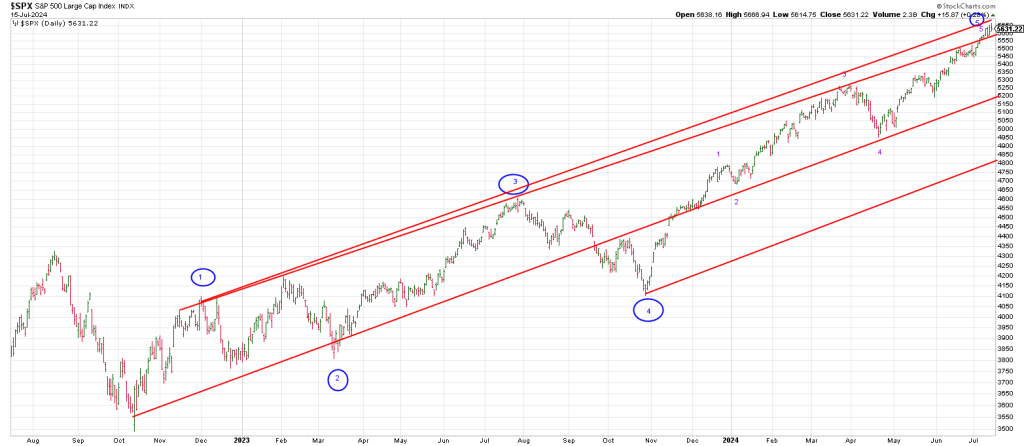
The 3rd wave high was late July 2023. The impulse to the downside is likely to begin in July synchronous with a one-year cycle.
Within the 5th wave which started up in late October 2023 you can see a subdivision of 5 waves.
So we have a 5th of a 5th of some degree completing.
As we’ve presented and argued for several months, there is a strong likelihood that 5 waves are completing from the 2009 low, the 2002 low, and the 1932 low.
Cycles concur.
2024 is set to be a year of destiny.
There are several other synchronicities that align with the start of the greatest bull of all starting in 1982, and theoretically still charging, which we will walk thru in tomorrow’s report.
From the 1929 crash to the 1987 crash is 58 years.
From the Secular Bull Market top in 1966 plus 58 years is 2024.
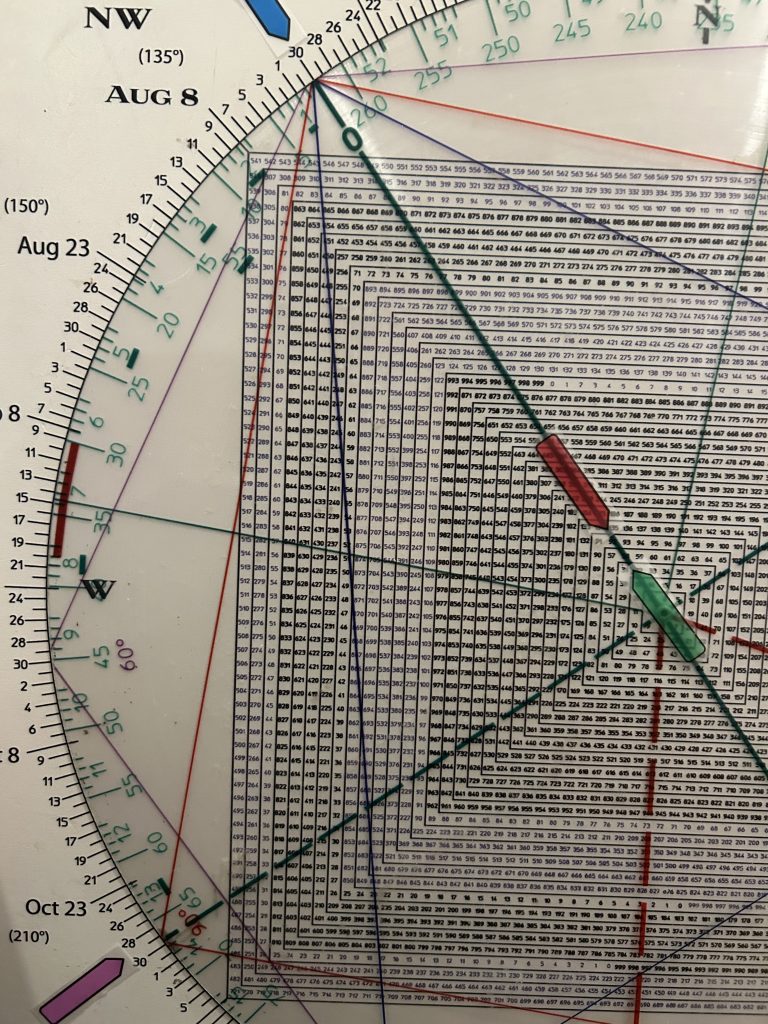
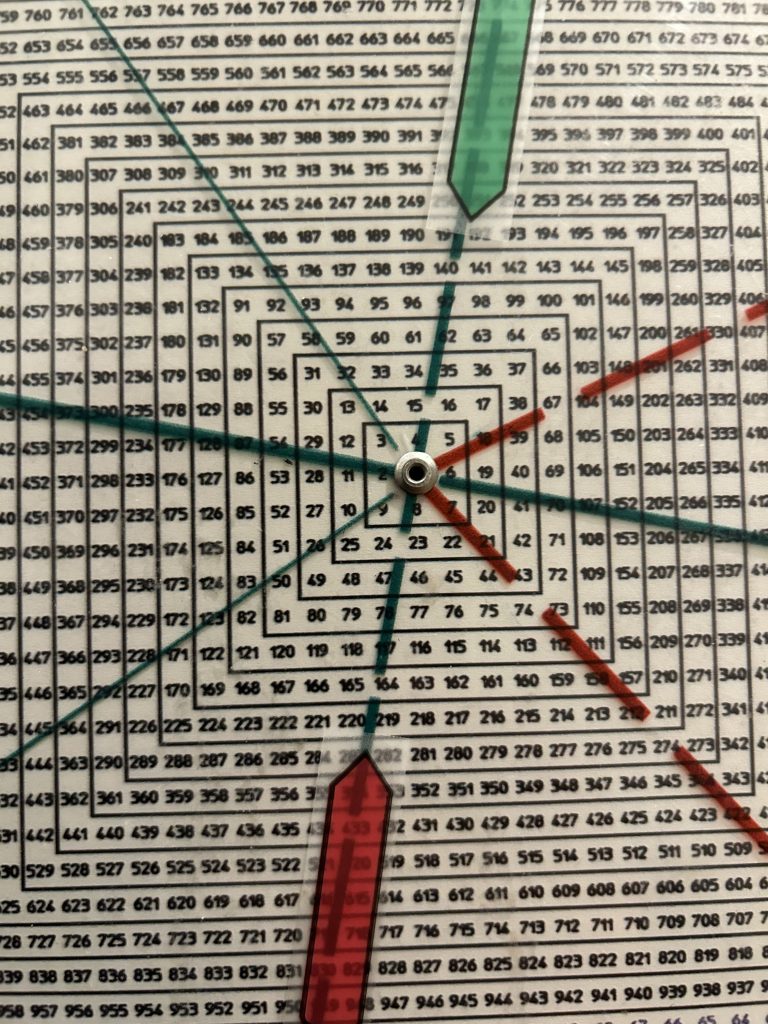
On my Square of 9 Time/Price Calculator when we anchor “0” to the number 58 we see that one full rev of 360 degrees or one full square up is 92.
We are 92 years from The Great Depression low in JULY 1932.
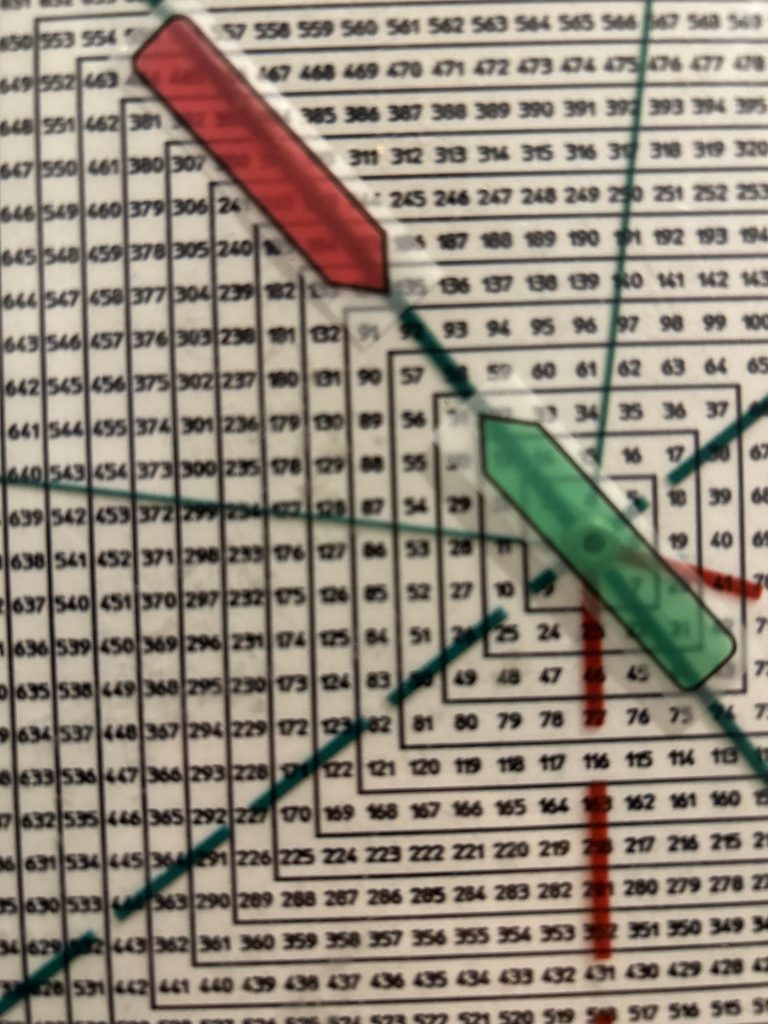
Notice that 58 squares-out with October 29th, the Big Kahuna in 1929.
Both 58 and 92 “point to” July 30/31st.
My takeaway is that the end of this month is a major market event. We may see Selling Panic or a Flash Crash.
The bottom of the red Trend Channel in the above SPX ties to the 4800 region.
If the SPX drops to 4800 from the current 5650 high it represents a 15% drop.
That’s not even a crash. But if the speed of the downdraft is accelerated, it will clearly feel like a crash.
That said, breakage below the mid-channel line at the 5200 region opens the door to the April low at 4950 and could see accelerated momentum BELOW the trend channel.
When parabolic advances unravel they often revisit the scene of the crime…in this case that’s the October 2023 low at 4100.
Never say never. Notice that the October 2023 low was produced only after breakage of the trend channel from 2022-2023.
We could see the bottom of the trend channel break again…easily.
Panics by definition don’t adhere to trend lines/channels.
There is a Fibonacci relationship pointing to 2024 being a major turning point.
As noted above it was 58 years from the 1929 crash to the 1987 crash.
It is 95 years from 1929 to 2024.
95/58= a Fibonacci 1.62
Using the relationship of 37 years from 1987 to 2024
And 58 years from 1928 to 1987 we see that 58/37 also ties closely to a 1.6 Fibonacci ratio.
The low in October 2022 was 349 (3490 SPX).
On the Square of 9, we see that 349 is opposition July 12th. It’s always the “week of”.
So what?
Well if you look closely you will see that the Square of 9 called the low in October 2022.
How?
349 squares-out with October 13, the day of the low in 2022.
This week bears watching (pun intended).
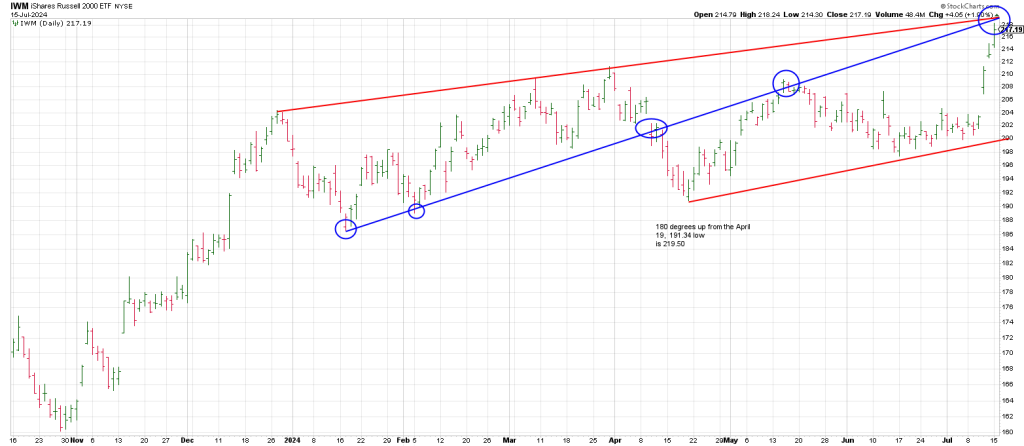
IWM despite its recent rip may be exhausting.
A daily IWM shows converging trend lines around 219.
180 degrees up from the 194.40 April 19th low is 219.50
SMH is the tip of the speculative spear.
It left a Key Reversal Day on June 20th and again on July 11th.
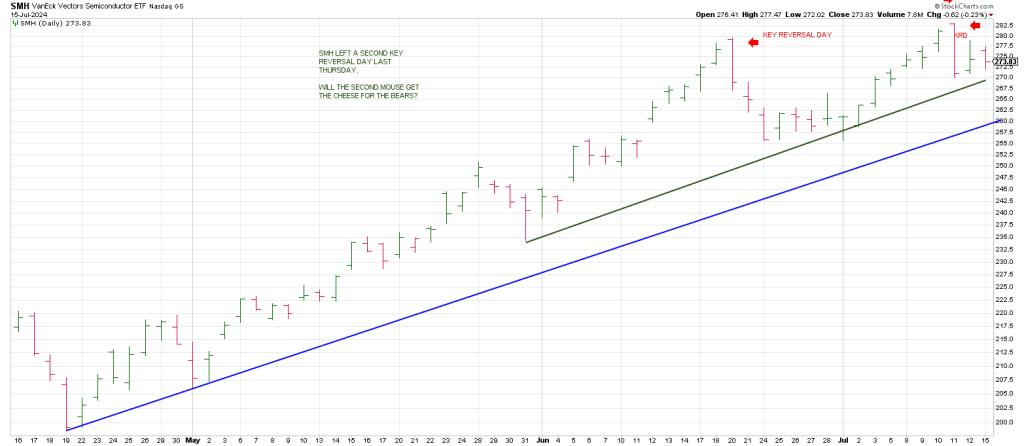
Because the July 11th KRD was within a 20 day window from the earlier June 20 signal, it produced a Soup Nazi sell signal and a Gilligan sell signal (a gap up to a new 60 day high with a close at/near session lows.
Will the 2nd mouse get the cheese for the bears?
Watch the 20 day ma at 208.
What do we do while waiting for The Turn.
We take the long and the short setups as they present.
Volatility precedes price so the opportunities have been spectacular on both sides.
Let’s walk thru a few recent Hit and Run plays.
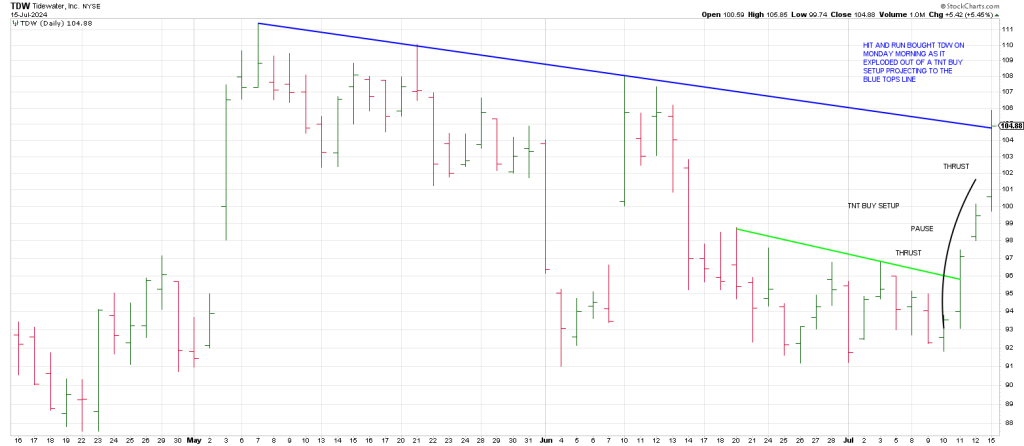
Hit and Run bought TDW Monday on the projection to the blue Tops Line
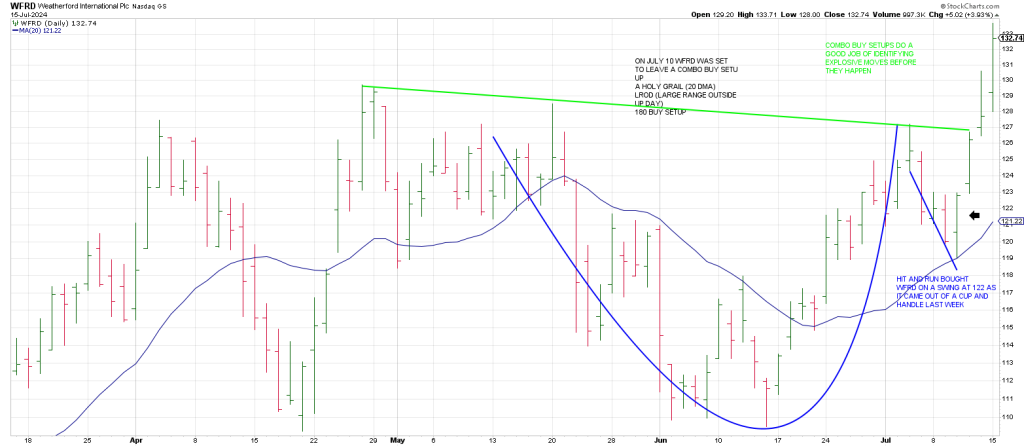
We had a double position in WFRD long from 119 and 122.
This is because it was a Combo setup, meaning multiple signals.
Multiple patterns/signals stack the odds in your favor for Pay Dirt.
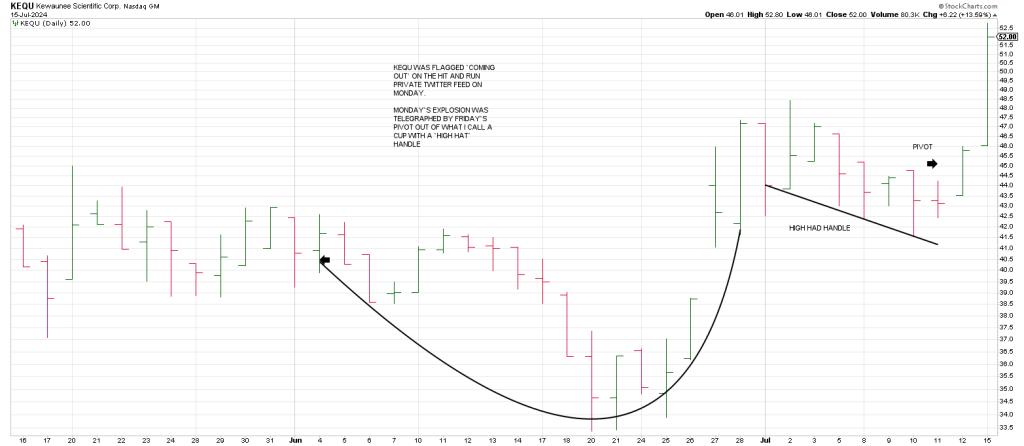
KEQU is a biotech that was flagged as a long play on Monday on the Hit and Run Private Twitter Feed.
It was coming out of what I call a High Hat Handle of a Cup and Handle pattern
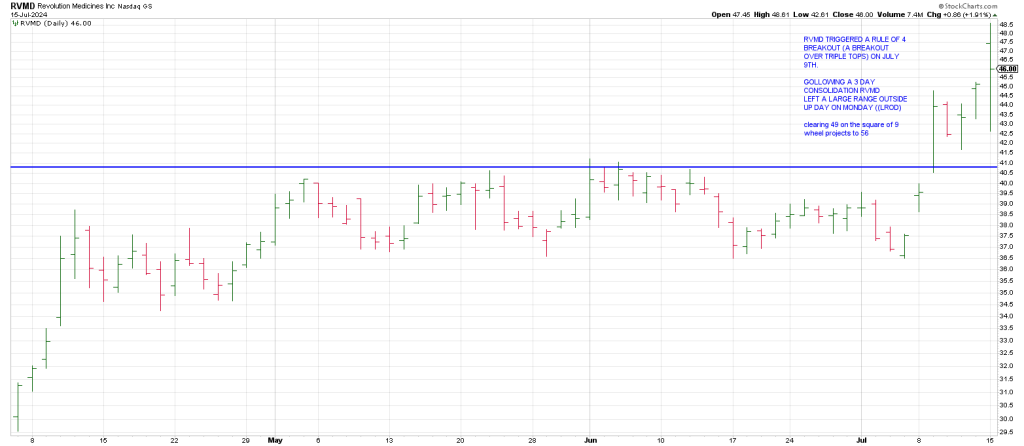
RVMD is another biotech that surged on Monday in a continuation from last weeks Rule of 4 Breakout
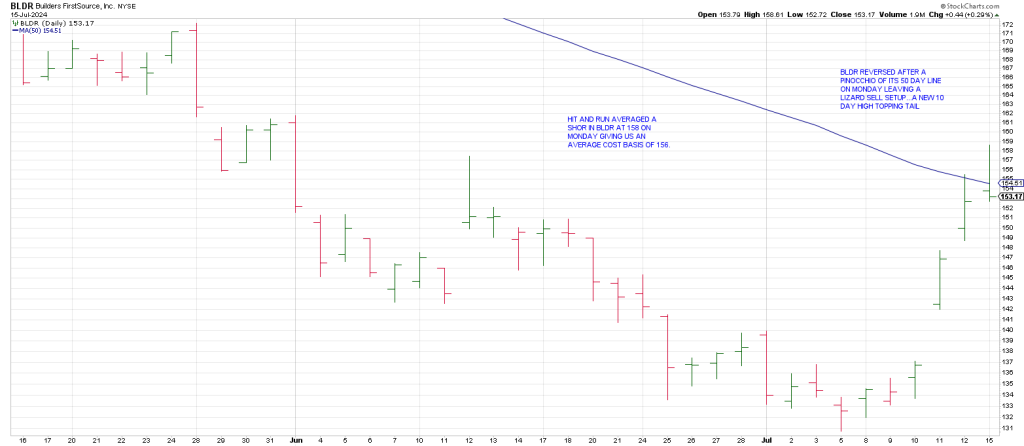
BLDR is a name Hit and Run has shorted several times on a swing over the last several months.
On Monday we averaged a short at 158 as it reversed from a Pinocchio of its 50 day line.
In sum, July sets up for a major turn according to Time, Price and Patten.
Since the 2022 downdraft was an escalator, the Rule of Alternation suggests the sell-off, when it starts, has a strong likelihood of being an elevator.