Below is a monthly SPX encompassing the 2000 Bubble Top followed by the large 9 year A B C “correction”.
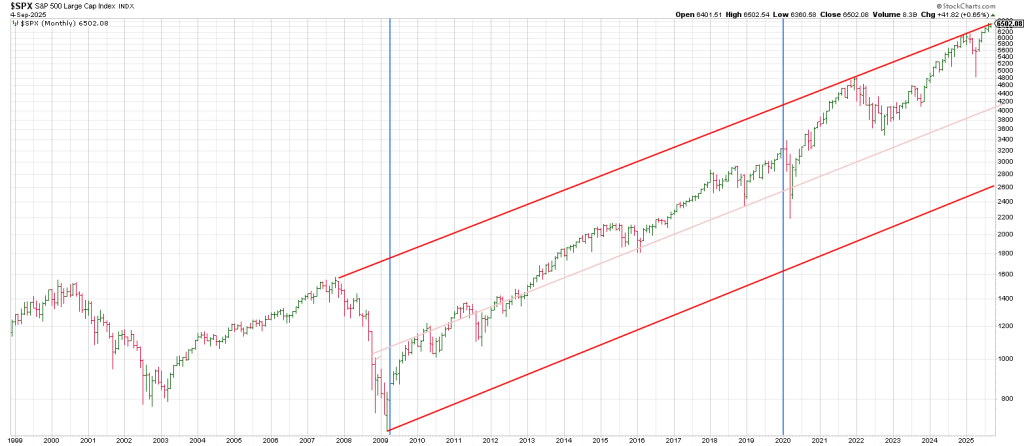
From the 2009 low the market advanced 9 years into 2018 when the smooth slope of momentum ended and volatility came out of hibernation.
Another 9 years from 2018 gives 2027
However because the Primary Low is in 2008 when the NDX struck low, both 2026 AND 2027 are in the crosshairs.
This 9 year cycle is important because it is one-half the Saros or Eclipse Cycle we spoke about earlier this week.
So we have a possible Low (2008/9) to High (2018) to Low Cycle (2027) on the table.
If 2027 is going to be a major low then a major high has to precede it
There are many instances of parabolic tops being followed by waterfall lows 2 years later.
For example 1929-1930 to 1932.
2000 to 2002.
2007 to 2009.
The implication is 2025 will mark a major top. And there isn’t a long time to go.
Indeed the SPX closed at a record high on Thursday.
However it was largely courtesy of AMZN and META picking up the baton from AAPL and GOOG on Wednesday.
The Hand is adept at gaming baskets and ETF’s to drive the market.
I grew up hearing my dad tell me “Markets don’t move, they are moved”.
Now they are moved more easily than ever. There are more ETF’s than there are stocks.
There are double and triple ETF’s. In short there are more ways to move/manipulate the market than you can shake a candle stick at.
2025 also marks half the Bibilical 50 year Jubllee Cycle.
25 years ago was the 2000 top.
25 years before that is 1975. A major bear market ended in December 1974.
25 years before 1974 is 1949 when a major Secular Bull Market started.
25 years prior to 1949 is 1924 which in reality is when the Roaring Twenties Bull Run occurred.
So 2025 is a big deal. And November 2025 is a big deal as you will see below.
The question is do we get a correction first or continue to push higher into November.
I’ve mentioned this before but it bears repeating: anchoring ‘zero’ to 2025 in the number grid (using the grid as years versus numbers) shows that 2025 points to November 7.
A top leading into 2026 demands caution: 2026 is 38 years from 1987.
38 points to October 29th. We all know that was The Big Kahuna.
If 2026 is going to see a waterfall decline we have to have a top first.
To get waterfall declines you need to have a vertical ascent.
We had a vertical move from 2020 low to late 2021.
The drop that followed was a stair step affair.
In keeping with the Principle of Alternation the indication is a bear market in 2026 will be a waterfall.
Let’s look at some synchronicity with the 2000- 2025 Gann Tops.
At the end of the day as Gann would say, time and price are one in the same.
That is why when they “come together” it is wise to expect a change in trend.
The monthly SPX below is the same as the first one except that we’re going to show what I think you will agree are remarkable synergies.
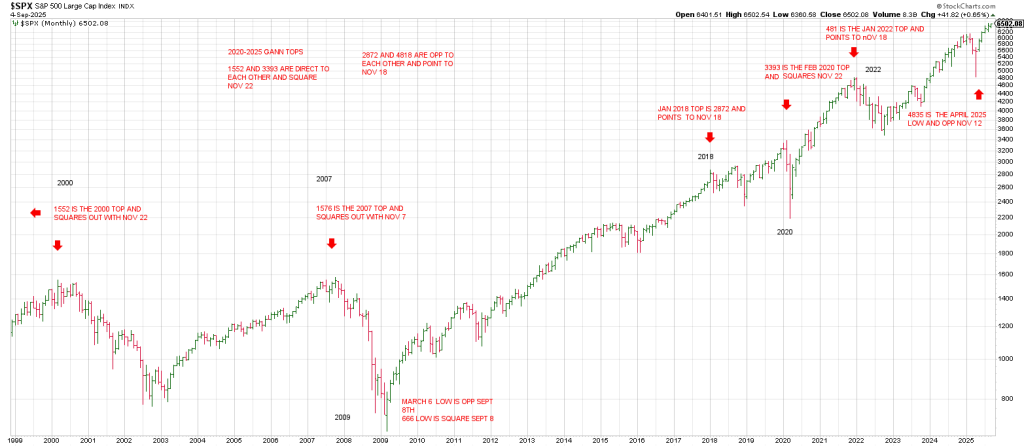
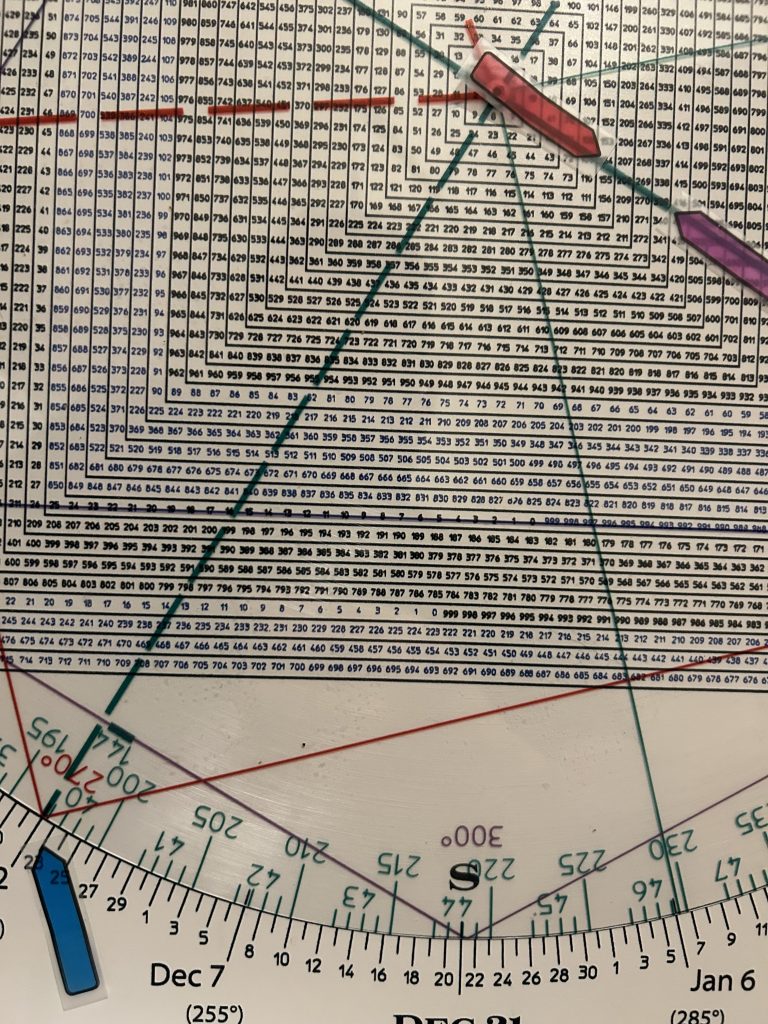
The 2000 SPX top was 1552 which squares-out with November 22. To work easily with the Sq of 9 Wheel I am moving the decimal point and using 155.
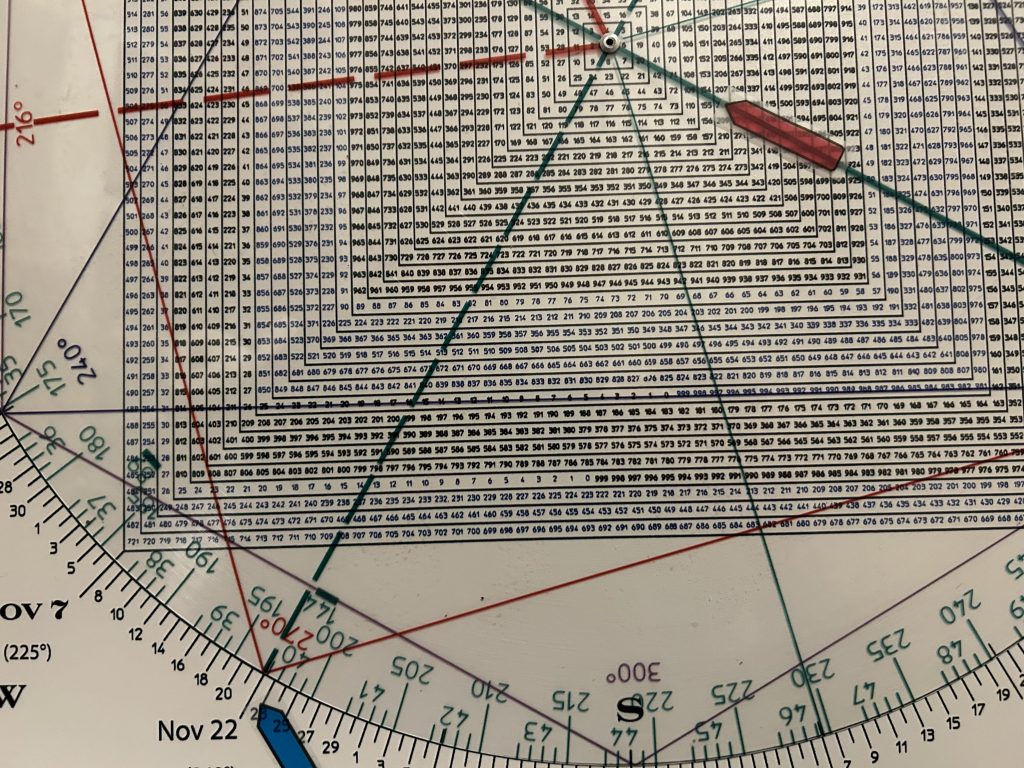
The 2007 top was 1576 (157) which squares out with November 7. Remember Nov 7 aligns with the year 2025.
1552 (155) and 3393 (339) , the 2020 pre-crash high, are direct to and square November 22 region.
The important January 2018 high (see above) was 2872 (287) points to Nov 18.
The March 2020 low is 219 (2191) and is square September 15.
I think this is very important because of the 5 year cycle from 2020.
2872 (287), the Jan 2018 top and 4818 (481), the Jan 2022 top, are opposition each other and POINT TO Nov 18.
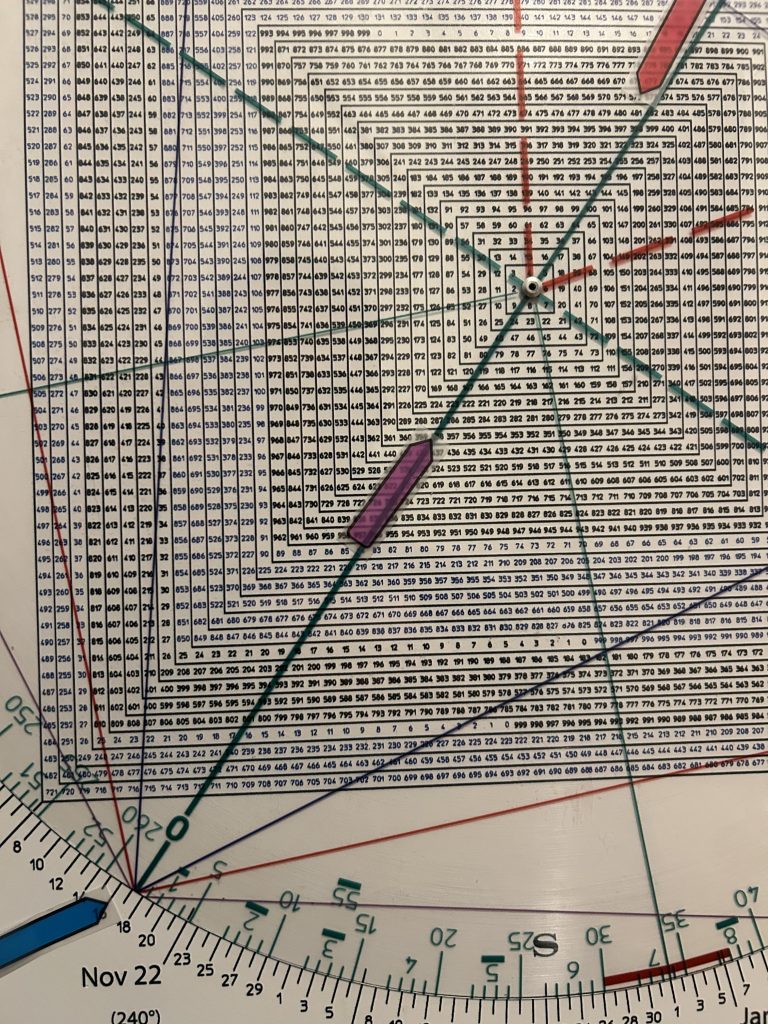
Finally the 4835 (483) April 2025 low is opposition Nov 12.
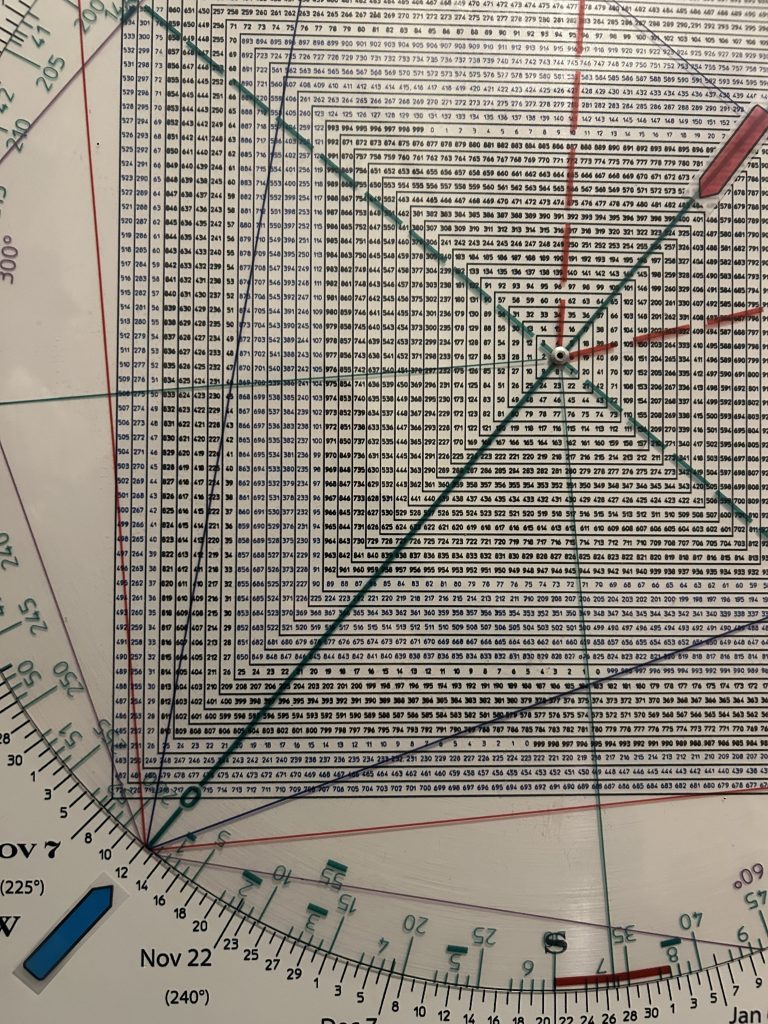
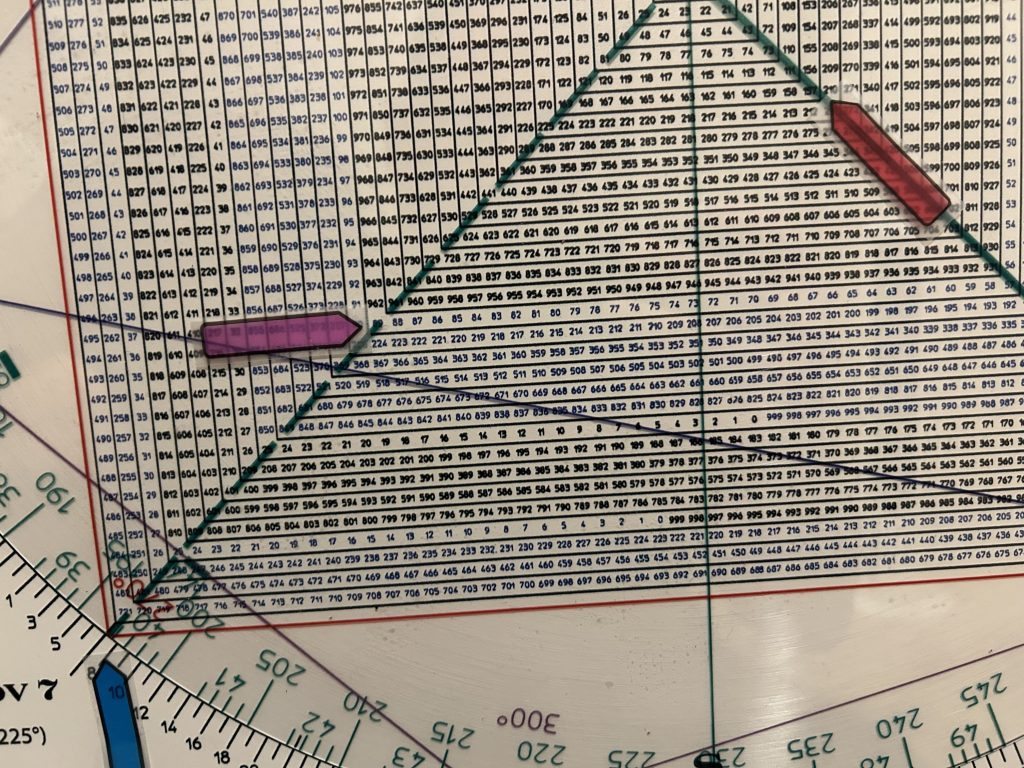
Of course the anniversary of the real low of the last Bear was Nov 21, 2008.
That is 17 years ago. On the Square of 9 Wheel 17 is straight across and opposite November 7.
A lot triangulates with November and week of November 7 in particular.
November 7 squares out with 651 (6510).
We will be at 6510 on the open today.
Let’s see.