“If it keeps on rainin’, levee’s goin’ to break” When the Levee Breaks, Led Zeppelin
In an interview in 1909, W.D. Gann commented on “cycles of prosperity and depression recurring at regular intervals of time.”
Gann stated, “Time is the great factor that proves all things.” ALL THINGS
This is what he meant by his discovery of the Time Factor.
In his coded novel, The Tunnel Thru the Air, Gann wrote about predicting the future based on the past repeating.
But the market isn’t a Rolex.
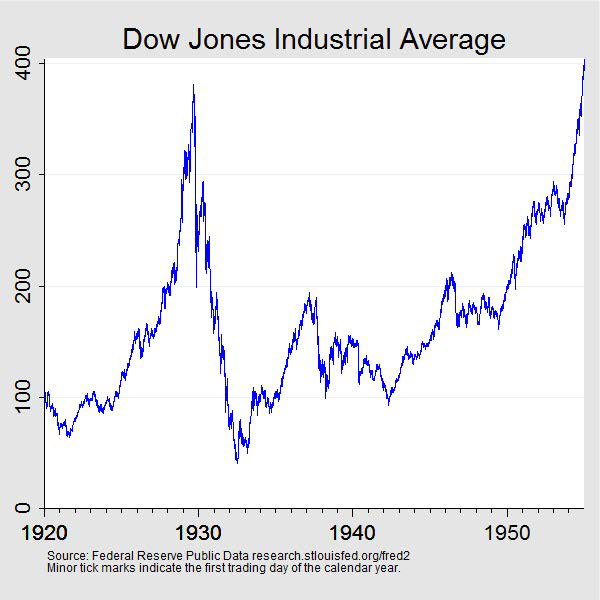
Even W.D. Gann forecast a Dow high for 1929 for August 7/8:
“One of the sharpest declines of the year is indicated. There will be loss of confidence by investors and the public will try to get out after it is too late.”
The high of course was September 3rd.
Perhaps he was looking at the fact that the bull market started on August 8th, 1896.
Can the market be forecast?
We know that yesterday, was Day 55 from the SPX July high and a potential crash day.
We’re not the only ones who know that.
I guarantee that The Working Group, The Plunge Protection Team, is aware.
As we’ve mentioned a Black and Blue Friday/Monday is a rare bird ever since Black Monday in 1987.
When you have as much debt as the U.S. has and there are BRICS looking to derail U.S. dollar hegemony, the stock market becomes a matter of national security.
The key to forecasting and cycles is that the past does not just repeat exactly like clockwork.
There are certain conditions that need to be in place to activate all the major time cycles such as the 20, 60, 90 and 100 year cycles.
In addition to these ‘natural’, geometric cycles. There are dynamic cycles spun from the markets own swings.
For example from the September 3, 1929 peak to the July 8, 1932 low is 1039 days or 2 years 10 months and 5 days or 34 months and 5 days.
Interestingly, from the January 3, 2022 top 1039 days forward is November 8, 2024.
Basically it falls right on the election…a few days after.
That’s using the SPX high.
If you use the QQQ high of November 22, 2021 going forward 1039 days gives September 26, 2024.
I think this whole period in September and November are extremely important to watch.
I think there is a likelihood that a mirror image foldback from the 1929 high to the 1932 low is playing out from late 2021 to the current time frame in 2024.
As noted previously this year, there is potential that the late 2021/early 2022 peak was the orthodox high leading to an Wave A decline into October 2022 which has been followed by a B Wave advance into 2024.
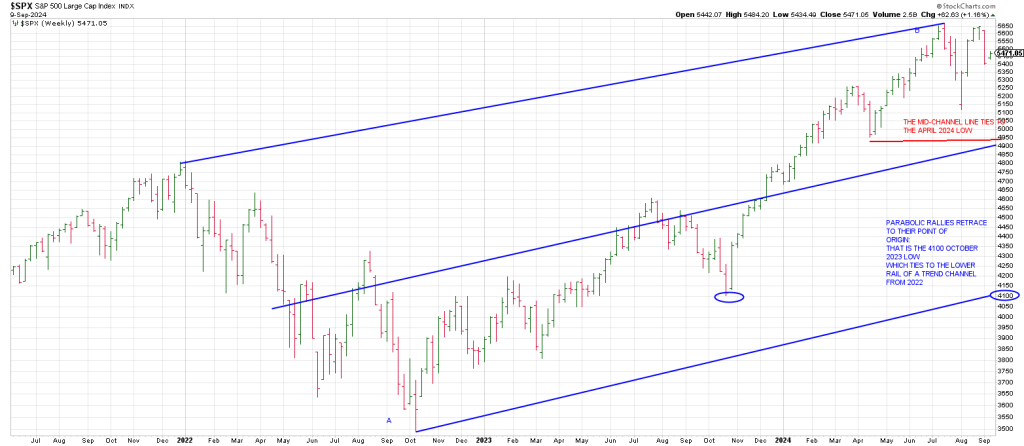
Yes, this B Wave has gone considerably higher than the 4800 SPX high of January 4, 2022.
But B waves can be big.
We saw a multi year B Wave from 2002 to 2007.
We saw a large B Wave from September 2019 to February 2020.
On a micro level, the orthodox high in January 2020 was followed by a B Wave rally into February 2020 prior to the C Wave Covid Crash.
If 1929 was a 100 year bottom, is it possible the cycle pointed to above marks a 100 year top?
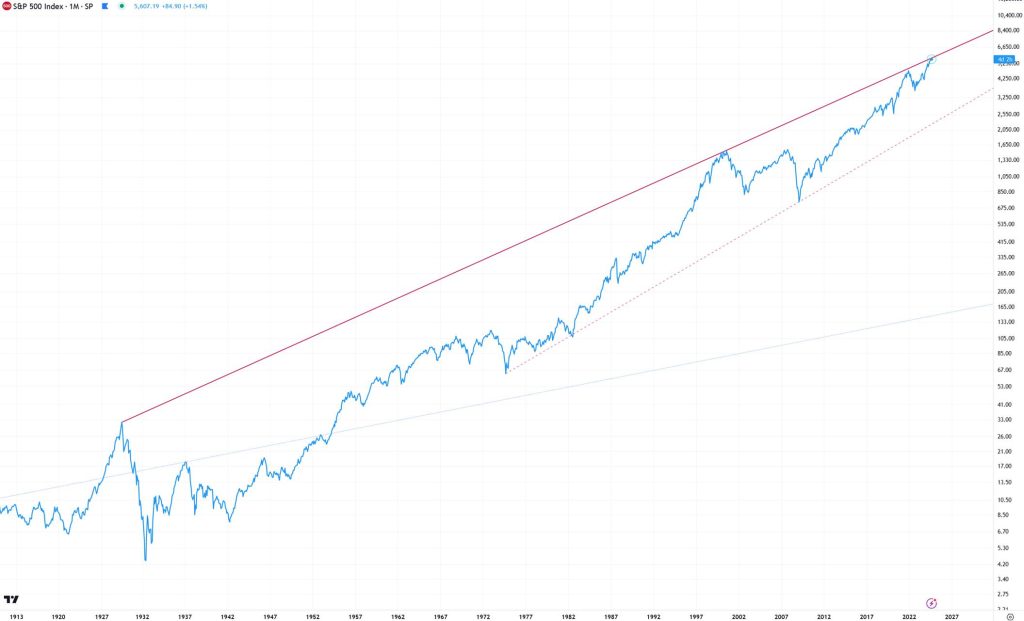
There is a 15 year Rising Wedge within the 50 year Rising Wedge.
The bottom of the 15 year Rising Wedge ties to 4800 the January 2022 top.
Checking the first 10 days off a final high I’m using August 30 as the final high) from 1973 forward, we almost never have two consecutive green days for the SPX in those first 10 days.
Almost every green day was followed by a red day.
Monday would be day 5.
In sum, since the August 30th high the SPX has turned its 3 Day Chart down (9/4)
We have a green day on Monday, but we don’t even have a turn up of the dailies.
Even tonight as I write, despite ORCL’s surge post-earnings, the futes are red.
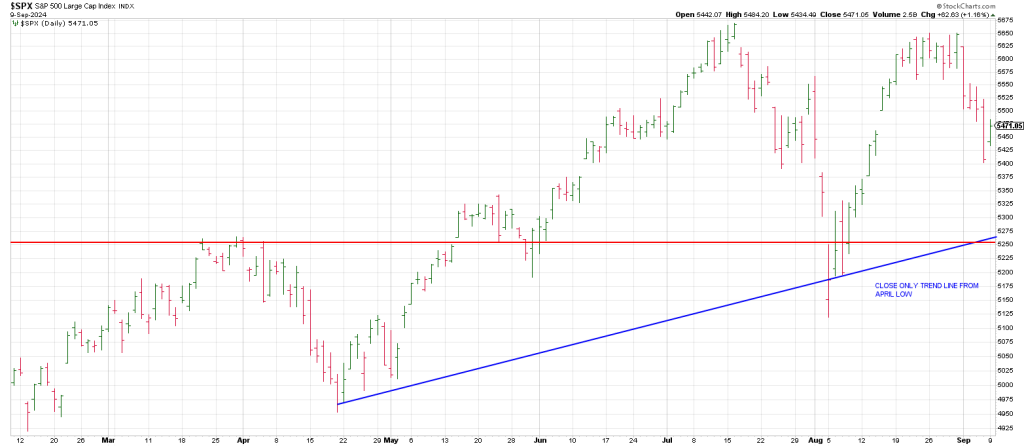
A 50% retrace of the decline off the August 30 high is 5526.
A push to the 5520 region ties to a probe of the overhead 50 day line.
If it happens today it will turn the dailies up and will look to buy puts.
50% of the August range is 5384. This ties closely to our 5373 number which is 360 degrees down from the all-time high.
I think there is a likelihood that we see a decline from the 5500 region to the 5373 region in coming days.
Breakage below 5373 opens the door to the next 90 degree decrement lower which is 5300.
Another 90 degrees down (for a 540 degree cube down) from there is 5256.
Interestingly 529 (5290) squares-out with the week of the election.