“The difference between success and failure in trading is the difference between one man knowing and following fixed rules and the other man guessing.”
– Jeff Cooper
I have been researching the price fluctuations of financial assets since I started my career at the famous Drexel Burnham office in Beverly Hills
Since 1996 I have produced a newsletter with market timing that also breaks down the structure of the market—the primary, secondary and short-term trends. As well, my service provides a Nightly Stock Report offering long and short swing and daytrade ideas.
In addition, members have access to the Hit & Run Private Twitter Feed where we follow up on current swing and daytrade positions as well as intraday alerts for new actionable ideas.
The Hit & Run Report, offered every morning, offers a technical view of the market based on TIME, PRICE and PATTERN.
Nowadays Macro has too many parameters for anyone to get it consistently right on every time frame. The charts are the only real edge. In a world of Algomatics gone wild.
I view the market from the same perspective as W D Gann who wrote that “Time is more important than price.
In short, there are no gurus, only cycles.
On Wall Street today, the conventional wisdom and popular “bromides” are that “price is truth” and that “only price pays.”
Yes, but price is a function of time.
There are no gurus, only cycles. And, the news breaks with the cycles, not the other way around.
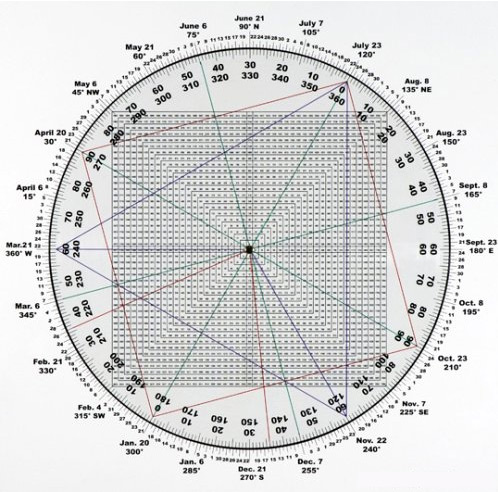
Our analysis of markets is unique because it integrates Time & Price with my Square of 9 Time & Price Calculator—the most powerful
Trading tool on the planet. Period.

Most all indicators are descriptive. The Square of 9 Wheel is predictive.
The Square of 9 Wheel is one of the tools that has allowed me to make some major calls including:
- The March 2000 top within one day.
- The late August 2000 secondary top.The week of the October 2002 bear market low.
- The week of the October 2007 bull market top.
- The March 6, 2009 bear market low to the day.
- The Christmas Crash low in 2018.
- A forecast in January 2020 that markets were on the cusp of a crash.
- A forecast in November 2021 that “the market will get hit hard in January to kick off a bear market.”
Try doing that without charts and without a tool that integrates Time & Price.
The Square of 9 Wheel/Calculator offers a visual representation of how time and price square-out or “meet”.
The essence of this market geometry is that time points to price and price points to time.
My 2005 DVD course The New Swing Chart Method maps the SPX from 1941 explaining how to determine the various phases of trend and how when Time and Price “square-out” or balance out, important turns often play out.
I do it because I want to, not because I have to. It keeps me “honest”. Because I must analyze the market and the position of individual leaders and laggards for members, it forces me to see things that I may not otherwise see if I was not “forced” to do so for clients.
This is the wild wild west in the markets. We have never been here before. No one alive knows what to expect and no one alive will have traded through anything like what is coming. Yes. This time is different and the need for guidance is great.
37 years in markets beginning at the famous Drexel Burnham office in Beverly Hills to his father Jack’s hedge fund before striking out on his own and creating the Hit and Run Methodology with two books in the late 1990’s.
We combine technical analysis with my Square of 9 Wheel and proprietary price and cycle methods including
My 3 Day and 3 Week Charts and an arsenal of proven patterns.
Whether we like it or not, as traders, we are all in the pattern recognition business.
My trading philosophy is speculation is observation, pure and experiential. Thinking isn’t necessary and often just gets us in trouble.
