I’ve mentioned many times in this space that markets play out in threes.
The 3 Year Cycle is an important intermediate term cycle.
It is 36 months which is 6 squared months.
In April the market struck a 3 Year Cycle low roughly 3 years from the 2022 low in June/October.
The Primary Low was June 2022 the Secondary Low was October 2022.
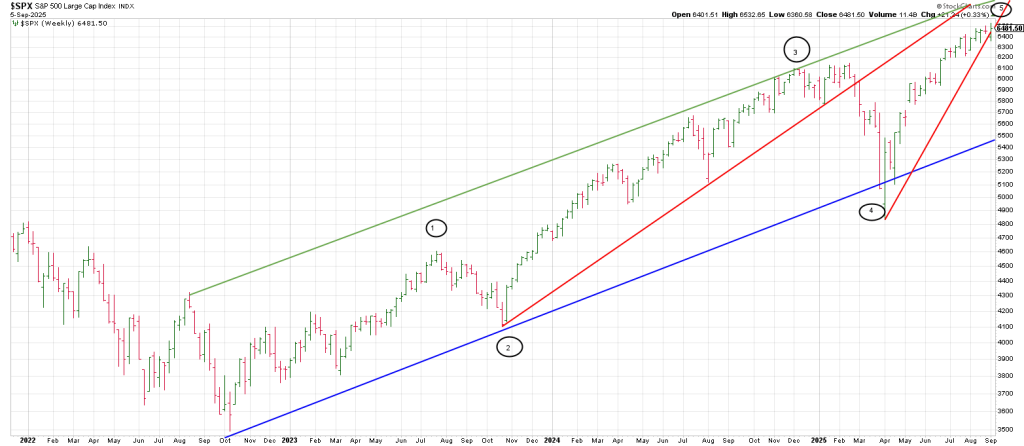
That means we have been in a 5th Wave advance since April 2025.
Since the Wave 2 corrective decline in 2022 coming off the March 2020 crash low was complex and drawn out, the Wave 4 into April 2025 correction was sharp and relatively short-lived in keeping with the Principle of Alternation.
If we don’t get a correction within this 5th wave in September I think the door is open to extend into November as shown in Friday’s report.
The current advance shows a Wave 5 high will culminate at the top of a trend channel (green) and a Ghost Line (red).
With last weeks outside down week that “Souped” below the prior high week of 8/28, we can draw a Bottoms Line from the April low.
The next break of this trendline the low of which is last weeks 6360 low will mark an important event…especially if it follows a push higher toward the top of the extended trend channel (green).
Alternatively the orthodox top was February 2025 exactly 5 years/60 months from the Feb 2020 peak, followed by an A Wave decline leading to a B Wave rally which has been progressing since April.
Yes, B Waves can be strong and carve out new highs. The advance into Feb 2020 was a B Wave.
A vicious C Wave followed which is par for the course of C Waves.
The bottom of volatility occurred on Sept 8, 2008 before exploding.
Are we at the bottom of volatility on this 17 year anniversary?
This week we get jobs revisions, PPI, CPI, jobless claims and sentiment.
It is the final inflation read before September’s Fed meeting.
The jobs numbers are going off the cliff. Could this reshape everything setting the stage for a 50 basis point rate cut sparking a final fling in stocks?
If the market doesn’t peak by the end of this week it could continue higher into early November and the square-outs shown last week.
If the market peaks this week a pronounced decline is expected after the FOMC meeting on Sept 17.
Any early –week dip could present a short-term buying opportunity.
On the radar.
A daily Bitcoin shows a Key Reversal Day on August 14th. This was a test failure of the July 14 high leaving a double top in the 125,000/126,000 region.
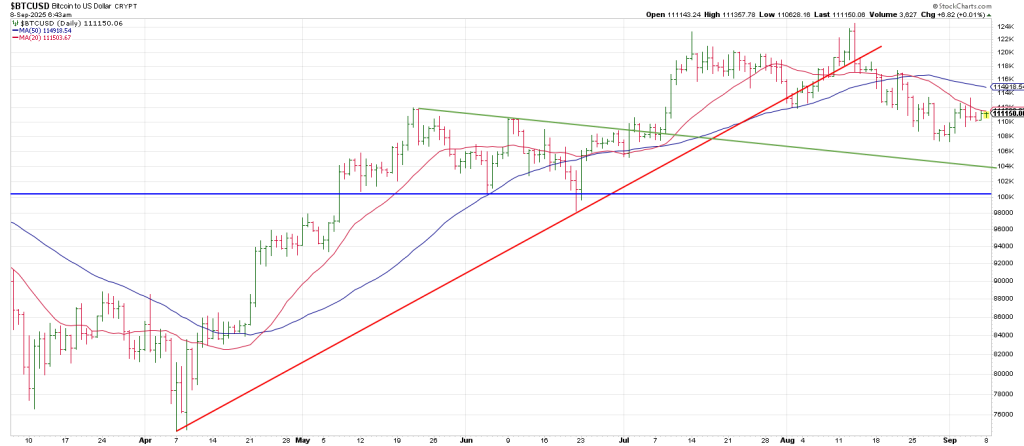
This double top has perpetuated a drop below a20/50 MA Bowtie which should present well-defined resistance in the 115,000 range.
As you know 104,000-105,000 ( which ties to the 200 DMA) is 180 degrees down from the all-time high and squares-out with early October.
As well, a Ghost Line (green) “points to” 104, 000 while 100,000 marks important horizontal support.
A full 360 degrees down from high ties to 85,000—the last impulse higher.
In sum, breakage below 104K and then 100K opens the door to 85,000.
A daily TSLA shows it broke out of a triangle in late August, checked-back, followed by a Breakaway Gap.
If the second mouse is getting the cheese, a bullish picture is unfolding.
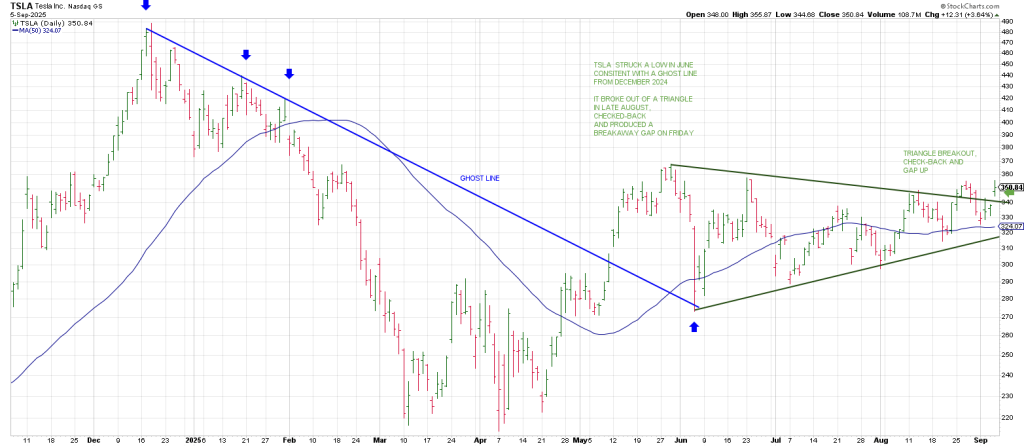
Notice how the start of TSLA triangle starts with a test of the blue Ghost Line
.Consequently, upside follow through opens the door to a test of the Gann 490 region.
Interestingly now how the 3rd lower high off the Dec 2024 top found bottom with a TRIPLE bottom this spring.
Markets truly do play out in threes.
The Roadmap for September 8
A choppy rally into 10:30 is followed by a quick potentially sharp pullback into 10:30
Then a choppy sideways move into 12:15 where another potentially sharp drop unfolds into 1:15.
A rally is projected from 1:15 into 2:15,
A pullback into 3:15 and a rally into the close.