Below is a weekly chart that shows GDXJ has never been this overbought going back 15 years.
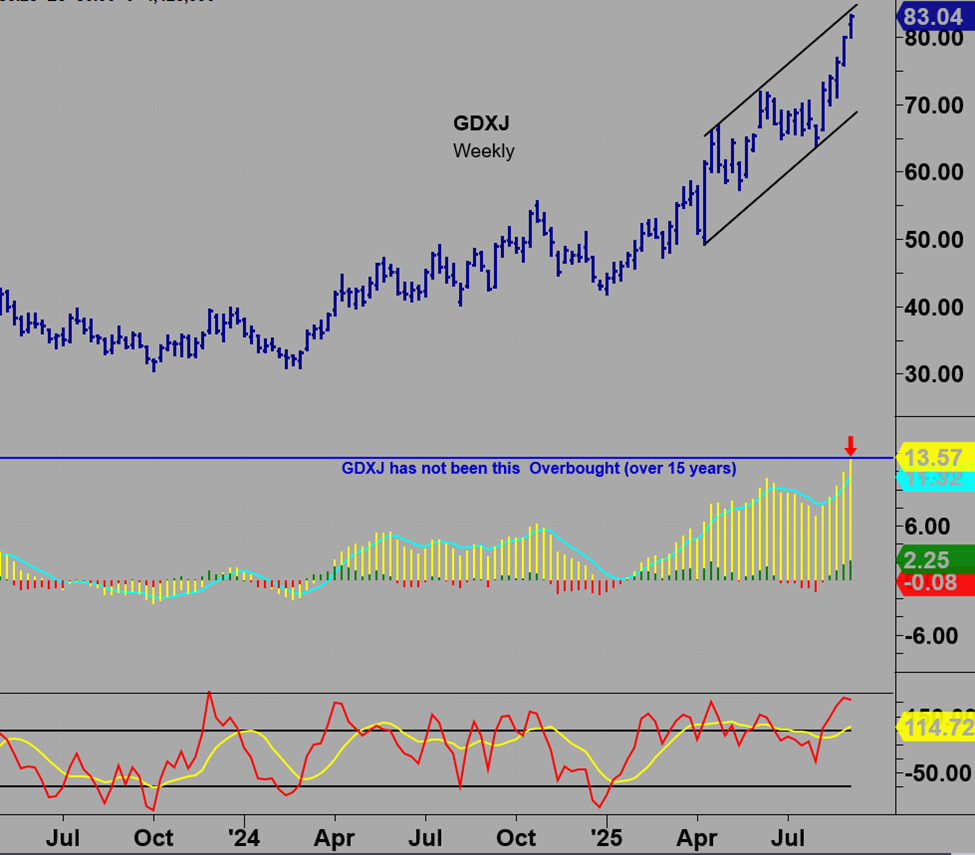
Also the weekly channel is now being approached again.
Granted, being extremely overbought is serious momentum and sometimes is even a buy signal.
I don’t think that’s what going on here given the vertical run this summer.
It is reminiscent of the spike top in August 2020 which perpetuated a 2 year bear.
Gold and the metals often top in August/September after Runaway Moves.
Think 2011 which was followed by a 5 year bear.
I don’t think the great bull run in the metals is over, but it may pay respect to these anniversaries with a meaningful correction…a 4th wave decline prior to a big bull 5th wave.
The chart below is a monthly GDXJ that I don’t think many have seen.
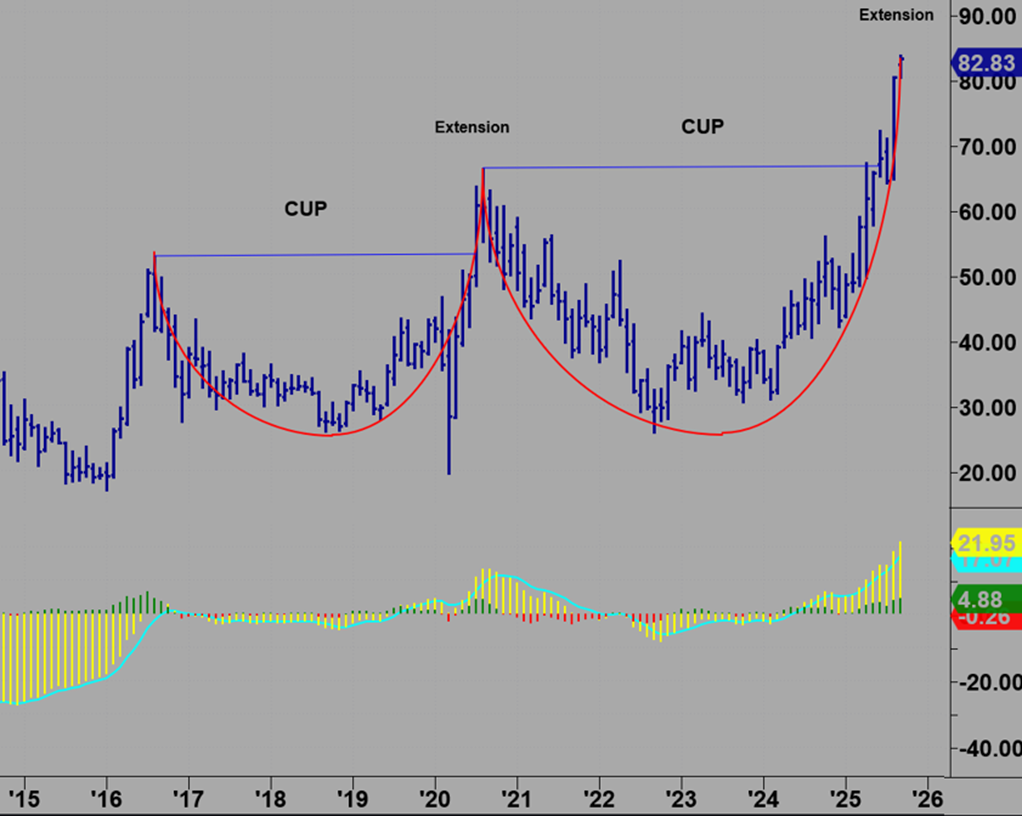
This shows the classic Cup pattern between 2016 and 2020 that is followed by an extension…and then a collapse.
Current, we are seeing virtually the same pattern to an even larger degree.
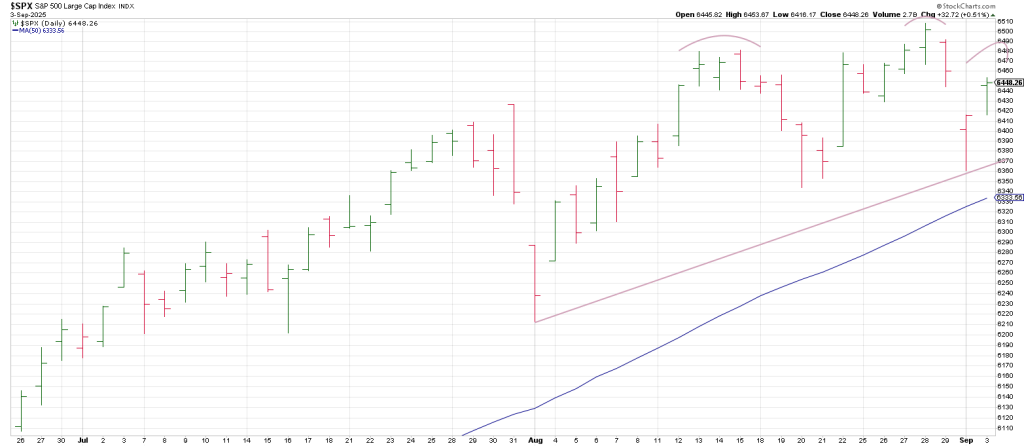
The chart below is a daily SPX for 2025.
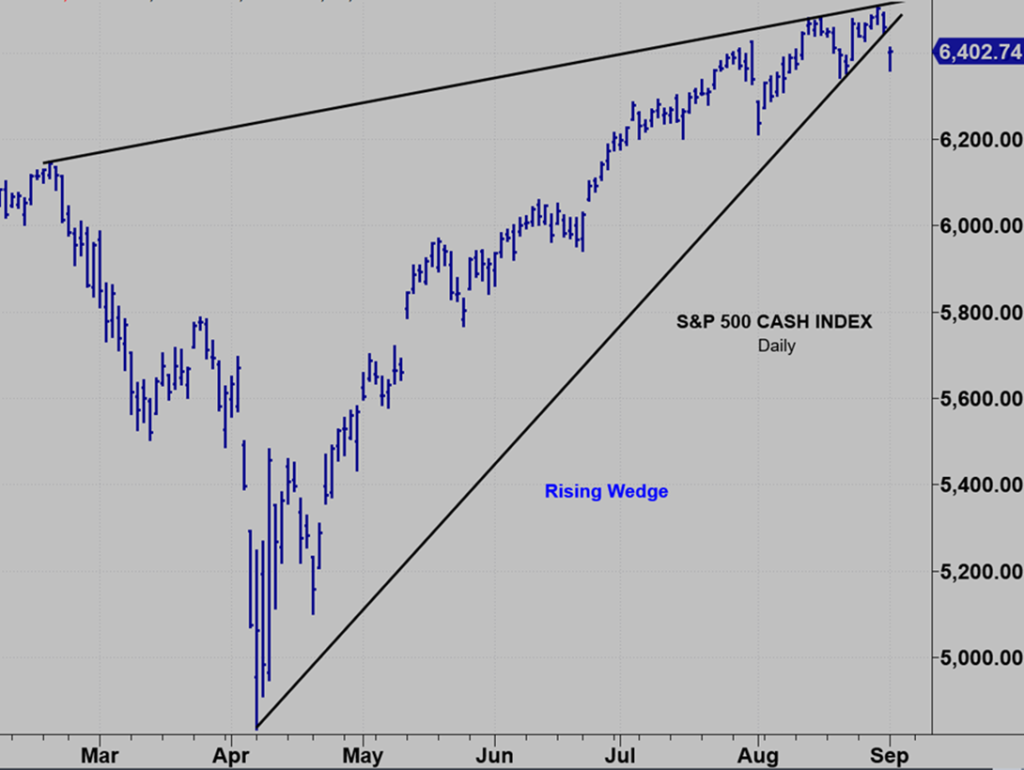
It may be the most incredible Rising Wedge break I have ever seen.
The presumption is this is the stat of a correction.
If so I would think that gold ….and Bitcoin should follow.
Yesterday there was a typo in the report regarding the 19 year Eclipse Cycle.
I mistakenly said 19 years ago is 2004.
It is 2006.
What I meant to say is that in 2004 there was a trend line breakout from the 2000 top (the declining red trend linen in the chart below).
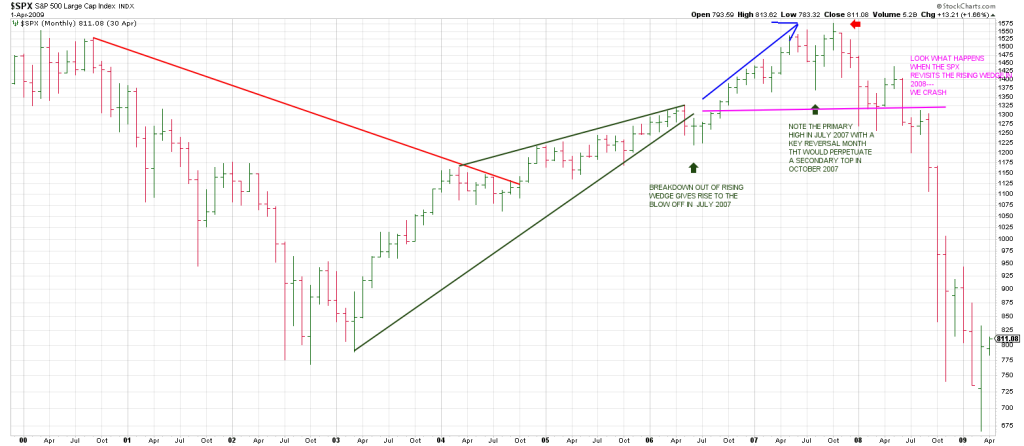
What I want to draw your attention to is the Rising Wedge from the 2002-2003 low to 2006.
Notice the break of the Rising Wedge in May/June 2006.
It proved to be a false breakdown that elicited the final leg up into July 2007.
A 9 month ramp.
Fast moves come from false moves.
Here’s where the Eclipse Cycle comes into play.
19 years ago is 2006.
That was the low, the setup for the Buying Climax into the July-October 2007 top.
It was the top prior to the Great Recession.
The false break to the low in the summer of 2006 was a big deal and it was 19 years ago.
19 years before that was 1987.
38 years ago and a summer top versus a low 19 years ago.
Bot pivots preceded big moves—one a blow off before a crash.
One a peak before a crash.
Looking at a long term chart, the 1987 crash is hard to identify now. It’s a pimple.
But it was the largest one day drop in history.
While it did not lead to an economic event, it was not short-lived as you might think.
It was a 3 year work-out—an A B C pattern over 3 years into the October 1990 low.
If the 19 year Eclipse Cycle is on the table then this September’s eclipses need to be watched, especially the September 21 solar eclipse with is right on top of this years Autumnal Equinox.
As for the short term picture, once again the market pulled a rabbit out of its hat.
On Tuesday the SPX had a brutal Breakaway Gap below its 20 DMA.
It mirrors the same breaks below the 20 DMA on August 1 and on August 20.
Each instance, like yesterday, saw the 20 DMA reclaimed immediately.
The T Rex in the ointment may be that this time the SPX may be flirting with a right shoulder of a Head and Shoulders Top.
If so breakage below a trend line connecting the August 1 low and the September 2 low will snap a Neckline.