“And a white, blinding light makes it all seem so right
And you feel like the king of the hill.” King of the Hill, Roger McGuinn
Every day this week I am going to present something that points to a Great Peak.
We’ve discussed the significance of the 5 year cycle several times in this space.
To recap a few examples:
1932 low saw an advance to 1937 high
1982 low saw an advance to 1987 peak
2002 low saw an advance to 2007 peak
Dec 1994 low saw an advance to Q1 2000 top
The Roaring Twenties Bull Run was in reality, as shown recently, 5 years from 1924 to 1929.
Amazing.
Why is the 5 year cycle important?
Perhaps because it is 60 months or a fractal of Gann’s Master 60 Year Cycle.
It is also half the Decennial Cycle which was very important to Gann.
5 years ago February 19, 2020 saw a pre-crash high into late March
In 2025 we had a February 19 pre-crash high into an April low.
There was a big impulse on May 14, 2020 that led to a persistent run that topped on September 2.
A 3 week 10% drop played out from Sept 2 to September 24.
3588 to 3209.
It’s crazy but on May 12, 2025 we saw a big impulse to the topside.
The SPX carved out a double bottom in late October 2020 with the September low.
The short-lived bottoms in September/October 2020 produced a Flamingo low perpetuating a 14 month advance into December 2021/January 2022.
That 10% drop starting from s September 2 2020 high doesn’t sound like a big deal but in today’s market that equates to a pullback to 5828.
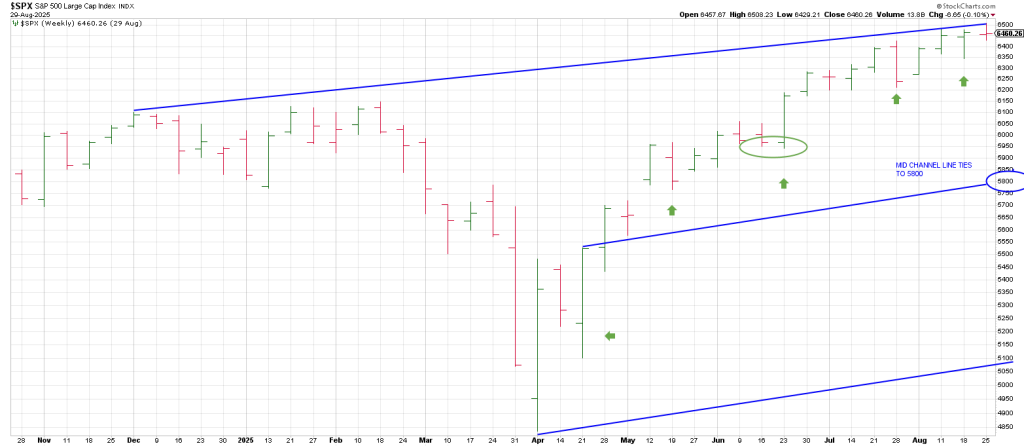
Remarkably, the 5800 region ties to a 5 year trend line shown on a weekly SPX further down.
The important thing is that we are 5 years from September 2, 2020.
Given that year had a top exactly on Feb 19 like 2025 followed by a roughly 7 week crash like 2025,
Caution is warranted.
This is just one of a remarkable convergence of cycles, events and patterns that starts in September 2025 and crescendos this fall.
First of all the end of August/early September is the anniversary of 3 of the biggest tops in the last 100 years.
Sept 3, 1929
August 25, 1987
Sept 1 2000
The Secondary High on the NDX was Sept 1, 2000. That was 5 months after the March 24, 2000 Primary High. Similar to the April 1930 Secondary High, 5-6 months from the September 3 1929 Primary High.
It was from September 2000 that the real crash in the NAZ/NDX played out into 2002-3.
In total from the March 2000 peak the NAZ lost nearly 80% mirroring the DJJIA loss from 1929 to 1932.
On September 7 there will be a blood moon total lunar eclipse.
A total lunar eclipse occurs when Earth passes between Moon and Sun, casting its shadow over our natural satellite. The titled orbit of Earth’s moon prevents us from experiencing a total lunar eclipse every month during the new moon phase. However, about THREE times every year, orbital mechanics conspire to bring the Earth, Moon and Sun into perfect alignment.
The periodicity and recurrence of eclipses if governed by the Saros cycle, a period of approximately 18 years…actually 6585 days.
Interestingly rounding out you get close to 666,
We won’t get into Nicola Tesla’s “secret to the universe 3 6 9” again here, but suffice to say that
September 3, 2025 is a 9 3 9 and of course Sept 6 is a 9 6 9.
The top in 1929 was on a 9 3 9 (September 3, (192) 9.
The bottom on March 6, 2009 is a 3 6 9.
The top on Sept 1, 2000 works out to a 9 3 (1 +2000 =3)
Be that as it may 18 years ago was the fall in 2007 and a major high.
The brunt of the decline didn’t hit until the bell rang in 2008.
It was a frustrating few months if you were a bear.
What else is new.
Anyway this Saros cycle is a period when lunar eclipses (and solar eclipses) seem to repeat.
The Earth, Moon and Sun return to the same relative positions resulting in a similar geometric pattern.
Eclipses were important to WD Gann’s method of forecasting.
He cryptically pointed to this in the subtitle to his coded novel The Tunnel Thru The Air Or Looking Back From 19 40.
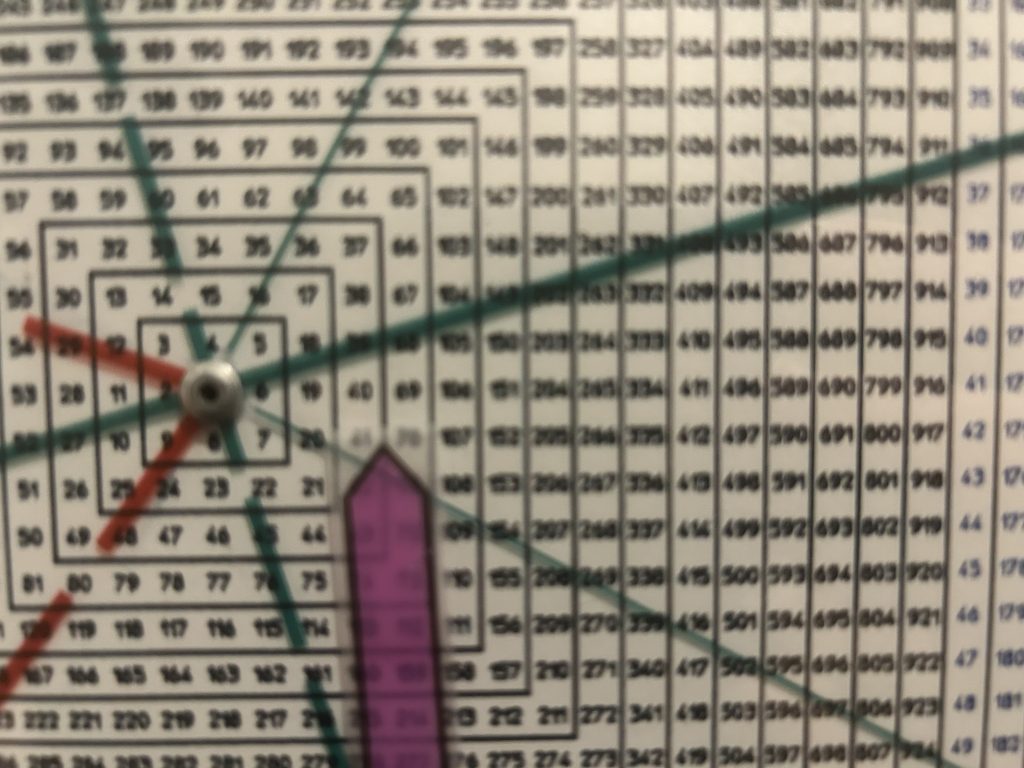
It was about 10 years after I produced my own Square of 9 Wheel
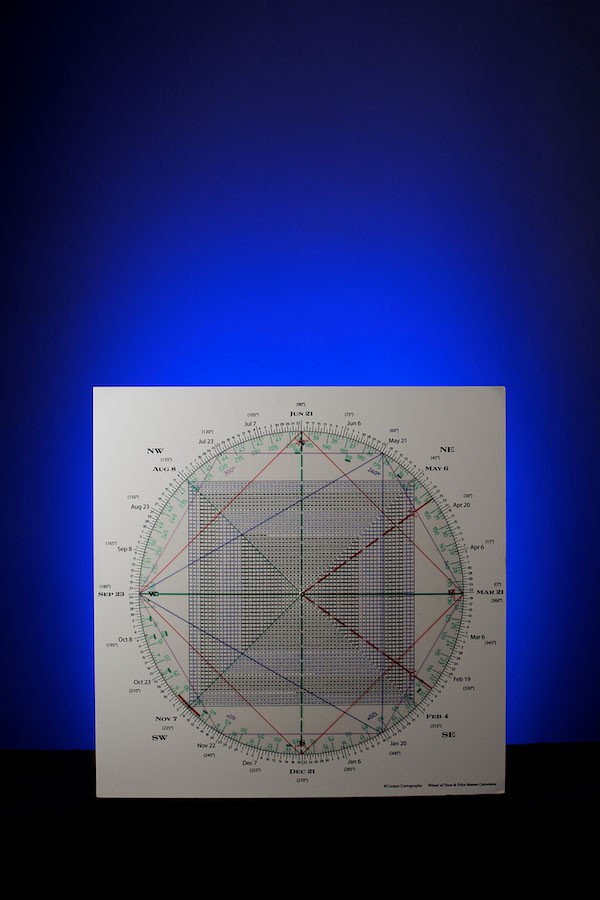
That I stumbled upon Gann’s secret.
Checking the Sq of 9 shows that looking back from the numbers 19 and 40 is the number 69.
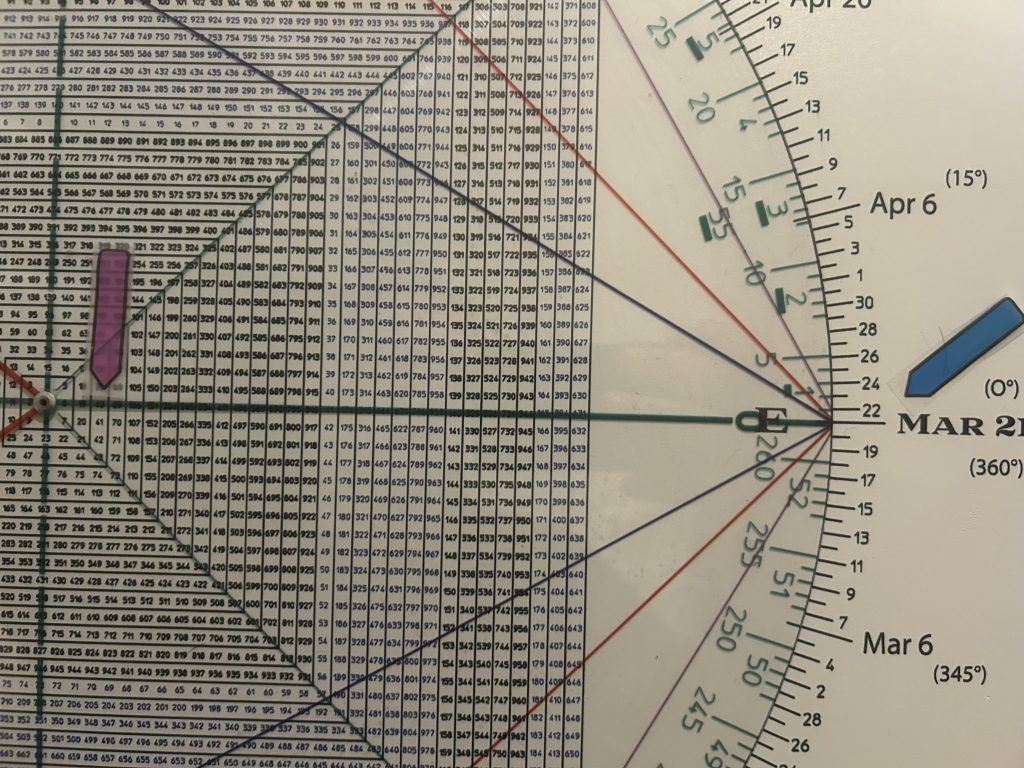
All three numbers point to March 21, the beginning of the Zodiac when the Sun is at 0 degrees Aries, the first sign of the Zodiac
69 is the symbol for Cancer ruled by the Moon.
So Gann is pointing out the significance of Sun/Moon alignments/cycles.
Not every Lunar or Solar Eclipse causes a big market move obviously.
It acts as a trigger if the market gun is “loaded”, ie if there is a convergence of many factors that setup. Such as another planetary aspect.
WD Gann’s trading methods had many sides, but one of the key factors determining his trading decisions was to study the position of the Sun and the Moon relative to the Earth AND importantly the PATTERNS that exist between these celestial bodies and the structure/pattern of the market.
Hence Looking Back From 19 40.
I mean it’s the subtitle. He couldn’t be more clear.
In my research I have found that the most powerful eclipse is the total Solar Eclipse.
There is a partial Solar Eclipse on Sept 21, 2025.
The Autumnal Equinox is on Monday September 22, 2025
We did a report earlier this year on how the period around the Autumnal Equinox has seen many tops of major advances. I will look for the report and post this week.
So Friday Sept 19/Monday Sept 22 look pivotal.
Will the market get magnetized lower for a 3 week downdraft ala the aforesaid period 5 years ago in 2020?
It should be easy to see. Watch for a turndown of the SPX weeklies where the index keeps going lower.
Keep in mind that EVERY turn down in the weeklies since the April low has defied a low…quickly.
There is one small exception there were two consecutive lower weekly lows on the week of June 23.
But let’s look at that bar.
The SPX exploded for a large range outside up week.
That low was 500 points ago on the week of June 23.
Interestingly 9/23 will be 90 degrees/days forward.
Think the week of Sept 23 is important? I do.
I believe Gann’s true trick of his eclipse method is matching these dates to other astrological events.
There is a Crash Cycle that I have known about for many years but never fully got it until last week.
Some market forecasters I realize now have gotten it wrong thinking it does not pinpoint The Turn.
It can.
Here’s where let’s call it the Crash Cycle has shown up:
Sept 7, 1929 bullseye
June 1, 1981. The DJIA tumbled from 1008 to 770 in August 1982.
May 14, 1987. The market exploded to an August 25 pre-crash high. When the May 14 low was taken out the market crashed. This is a very important concept The market has a memory like an elephant.
I’ll show this chart in tomorrow’s report. This article is already getting long.
August 29, 2000 bullseye
August 24, 2002, start of the final flush to the Oct 2002 low
August 6, 2008, the start of the heart of the Lehman Crash. From mid-August Bear Flag the DJIA dropped from 11,867 to 7,449 in mid November. The March 2009 was an Undercut Low.
November 24 2019, The market grinded a bit higher into a little double to in Jan/Feb and then the Covid Crash hit. Once again when the late November low was violated, it was Kate Bar the Door.
Katie is gargling.
November 17, 2021, the DJIA topped days later and double topped in early Jan. prior to a bear market.
November 11, 2023, a major low played out in late October 2023. The market “crashed up”.
The next instance is November 4, 2025.
This is an important week because on the Square if 9 Wheel the year 2025 points to November 7th.
As well from the Feb 19, 180 degrees/days is mid-August. The SPX saw a sharp pullback into August 20 and struck a new high on Thursday and is back to the mid August highs with Friday’s sell-off. Trade below the August peak that sticks is a bearish event
Mid-November is 270 degrees from the mid-Feb high. Early to mid- November is a critical time period.
In sum, I think the market is ripe for a sharp pullback in September.
If we are going to see a drive over 7,000 my expectation is that occurs following a September swoon.
The symmetry of the SPX weekly below from 2020 is intriguing .
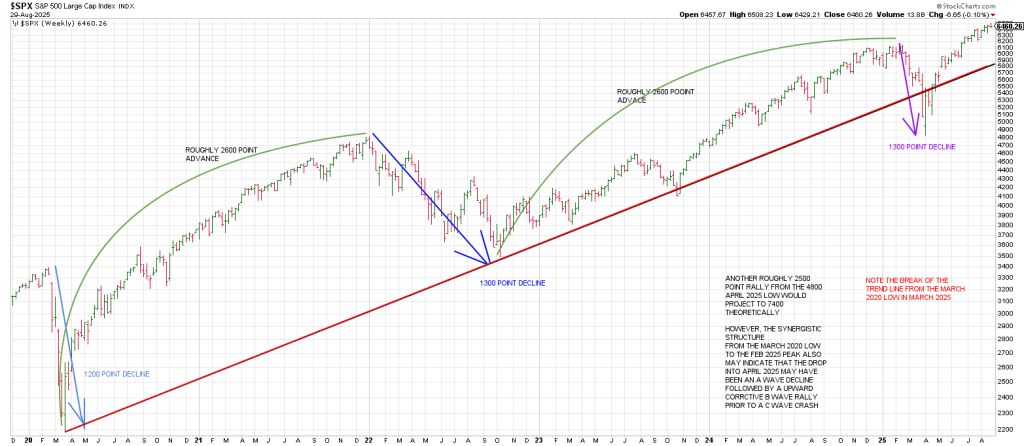
The SPX decline roughly 1200 points in the 2020 Covid Crash.
It advanced roughly 2600 points into late 2021.
The decline into October 2022 was roughly 1300 points mirror the drop in 2020.
Notice how the Principle of Alternation played out:
Waterfall in 2020
Stair-step decline in 2022.
Waterfall decline in 2025
Another roughly 2600 point advance played put from the October 2022 bottom.
What was the spring 2025 waterfall?
Yep around 1300 points.
Amazing
Another roughly 2600 points from the April 2025 low projects to 7400 theoreticall.
However, the synergistic structure from the March 2020 low to the Feb 2025 peak may indicate that the drop into April 2024 could have been an A Wave decline followed by an upward corrective B Wave rally. If so the next move would be a C Wave decline.
Often C waves are crashes.
The Covid Crash was a C Wave following a long extended B Wave to new highs similar to the new highs we have now.
One reason underpinning the A B C scenario for a downturn on deck is that the spring 2025 waterfall broke trend. It snapped a Bottoms line from the March 2020 low.
This is a major trend line break, it connects the March 2020 low, the October 2022 low and the big October 2023 low.
It may be that the break of the trend line has produced a squeeze higher—false moves lead to fast moves in the opposite direction.
We may have a 1st mouse (first break) gets the squeeze and the second mouse gets the cheese—for the bears.
On the big picture, a second break of this 5 year trendline comes in at the 5800 region.
Interestingly this ties to the 10% correction 5 years ago from a Sept 2 high!
If we get a big correction that hold 5800 that could perpetuate another leg up to the 7400 region.
But should the trend line at 5800 break at any time, I think it’s a Get Out Of Dodge sell signal.
Obviously, there are levels that will open the down door.
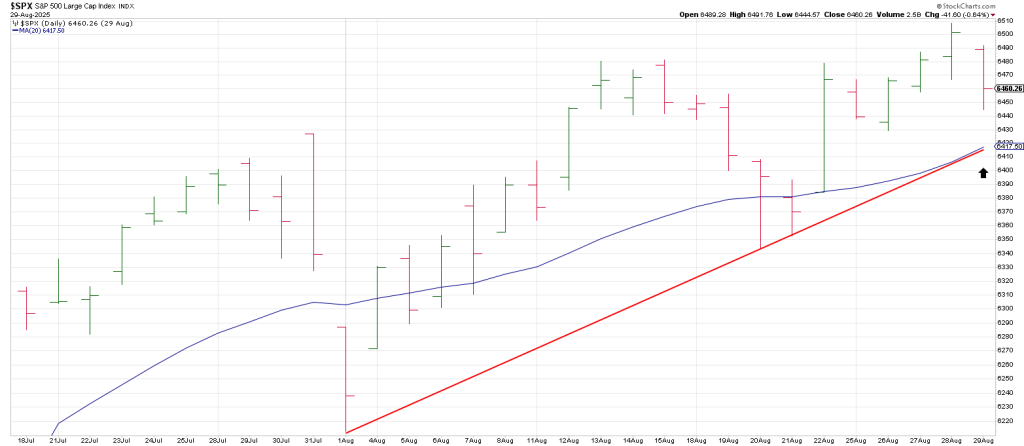
The major one is breakage below the 6425 July 31 Key Reversal Day high.
Interestingly that 6425 region currently ties to a rising trend line from the August 1 low which converges with the 20 DMA this week.
With many analysts with last weeks new high calling for 7000, Mr. Market may have a trick of his sleeve to shake out the complacency.
IF we’re going to see north of 7000 my expectation is that it comes in November.

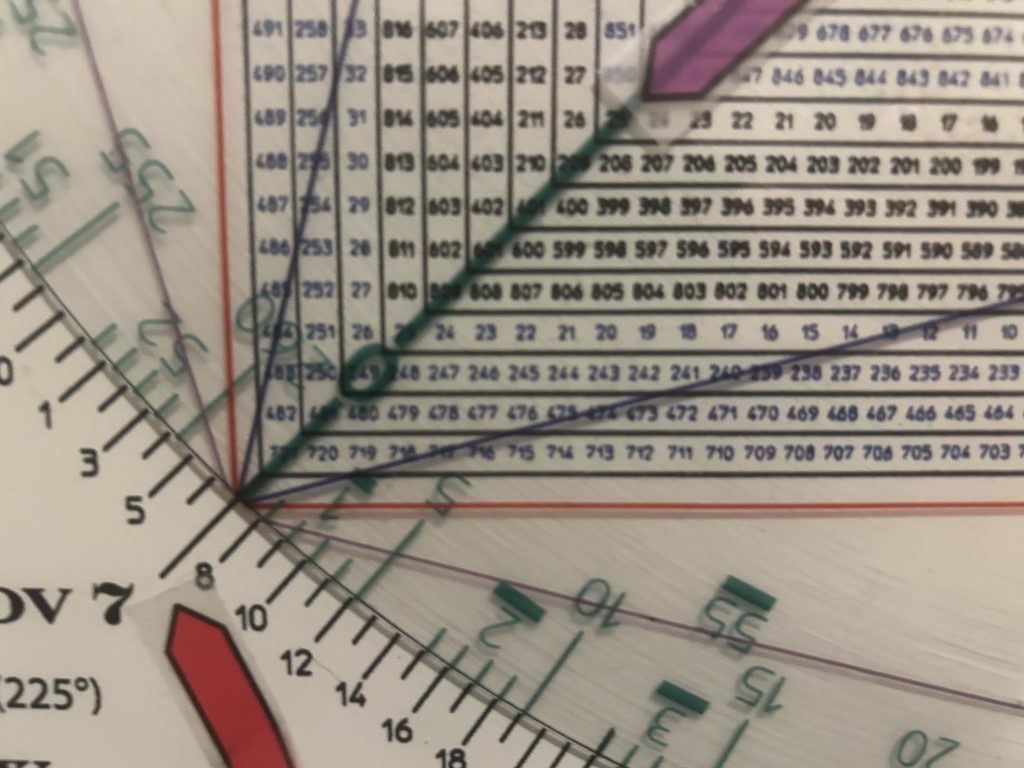
Square of 9 Wheel
Purchase your own Square of 9 Wheel. Shipping to US only. Contact Jeff for shipping outside the US.