“And you snatch your rattling last breaths
With deep-sea-diver sounds
And the flowers bloom
Like madness in the spring..” Aqualung, Jetho Tull
Cracks in the bull market are appearing but the market is not responding in typical fashion.
Allow me to explain.
The SPX carved out a Key Reversal Day on July 31st which also produced a Key Reversal Week.
The index followed through with authority the next session, August 1st with a Breakaway Gap below its 20 DMA.
That was the first clear cut break of the 20 DMA since the April low when the 20 day was recovered in late April.
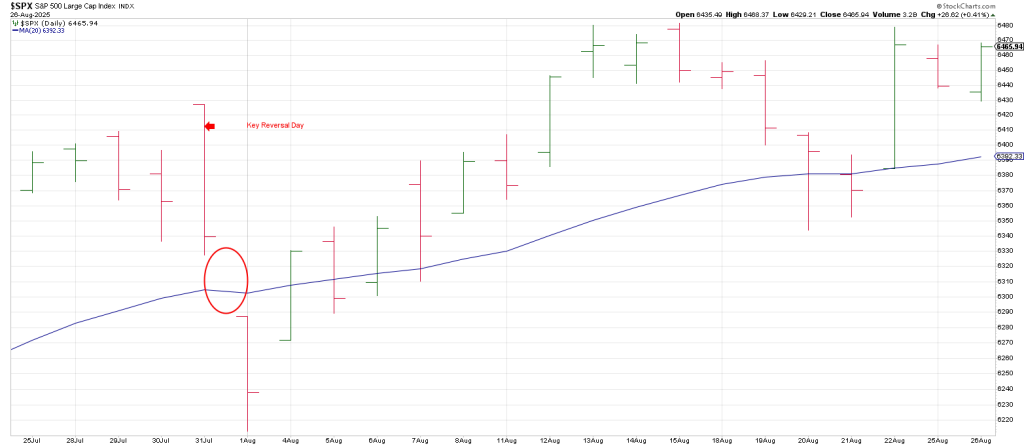
As mice go, the first one got the squeeze — the SPX walked back up to make a record all-time high on August 13/14 setting an all-time closing high of 6468.64.
Maybe something, maybe nothing but that is a Time/Price square-out with 647 (6470) being direct mid-August.
As all Hit and Run members know, as WD Gann wrote, “all important highs and lows are square-out— (where price or time or both, integrate, balance out geometrically,
It looked like the second mouse got the cheese for the bears when the SPX knifed back below the July 31st high.
But a funny thing happened on the way to a top—Mr. Powell came to town and he brought a pivot with him. At least that’s what their saying.
The SPX jackknifed towards the all time highs in one fell swoop, on a Friday in the summer with the largest Option Expiration in history.
Following last Friday’s surge the SPX has traced out two relatively narrow-range day’s inside Friday’s range.
So the market is not responding in textbook fashion to the late July Key Reversal.
You can’t say the market has shaken off the July Key Reversal since the SPX has been range bound/sideways for the most part for 3 weeks now but at the same time, it failed to succumb to it.
Indeed the SPX may be working on a mini Cup and Handle pattern indicating higher if we get follow thru.
This is the setup as the market coils into the historic late August/early September anniversary of 3 of the biggest tops in history; Sept 3, 1929, August 25, 1987 and Sept 1, 2000.
That’s not the whole story. I started out by saying cracks in the bull are appearing.
MSFT has multiple closes below its 50 DMA this week, despite a strong market rally on Tuesday.
META is sporting an Island Top.
PLTR is clinging to its 50 DMA well below its early August peak.
CRWD peaked in early July and is waterlogged at its 200 DMA.
ORCL closed below its 50 DMA on Tuesday.
AVGO may be working on a Right Shoulder.
SPOT struck a high in late June and remains below its 50 DMA
NFLX also struck a high in late June and remains below its 50 DMA>
These are Generals running from the field of battle.
Depending on who you talk to the Mag 7 are either the iconic growth names that must be owned or they are incorrectly perceived safe-havens —Incorrectly because the fundamental weaknesses of most stocks eventually overpower the markets and even the so-called safe havens ultimately sink as they become a source of funds.
The lead dog, the QQQ, may be working on a Right Shoulder—having left a Gilligan sell signal on August 13.
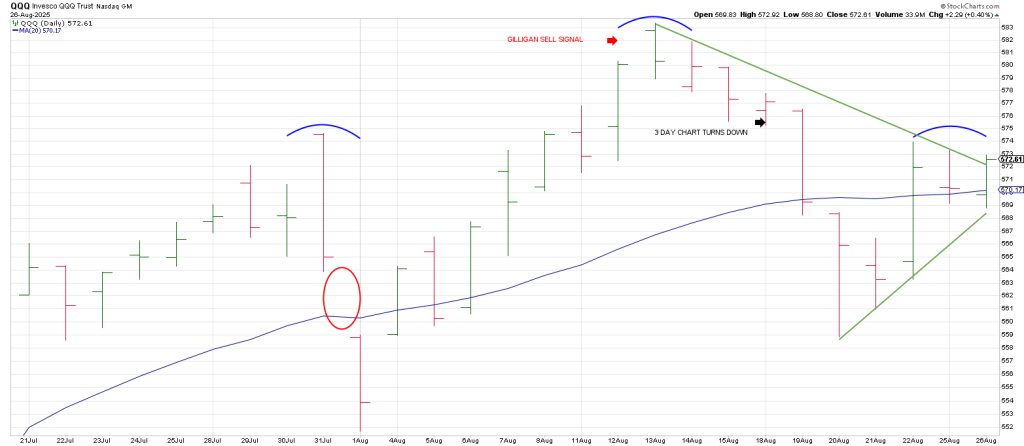
If the Q’s clear this 573 level and push higher offsetting the notion of a Right Shoulder it opens the door to new highs theoretically.
That said the Q’s turned their 3 Day Chart down right off the top on August 18 and have not been able to cobble together two consecutive higher daily highs.
If momentum doesn’t show up, the market is ready to break wide open.
After the bell NVDA reports.
Yesterday’s report walked thru NVDA’s potential Megaphone Top should it spike to the 186 region which is 2 cycles of 360 degrees up from its April low.
The market has an excuse to run today fueled by MDB’s earnings Tuesda which propelled it to a 61 point gain after the print.
MBD blew out as expected but the chart was suspect.
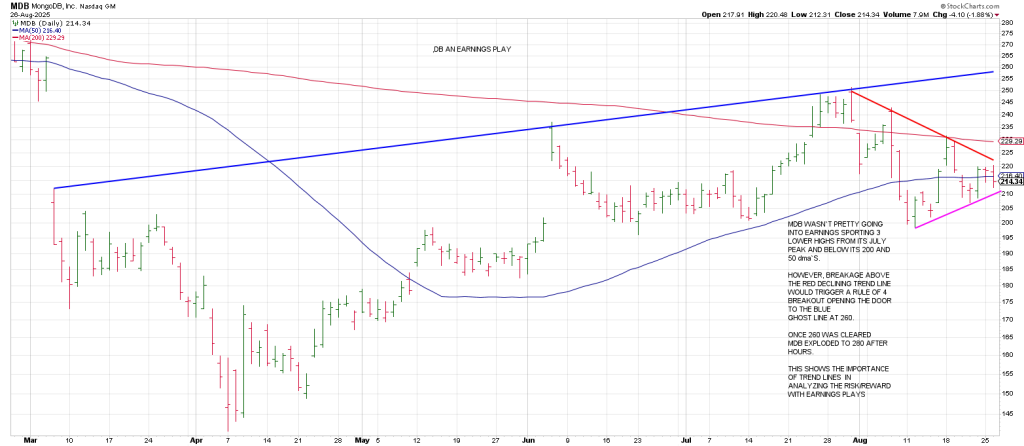
MDB wasn’t pretty going into earnings sporting 3 lower highs from its July peak.
As well it was heavy below its 200 and 50 DMA’s. However, breakage above the red declining trend line at 222 would trigger a Rule of Breakout opening the door to the blue Ghost Line at 260.
Once 260 was cleared, MDB exploded to 280 after hours.
This shows the importance of trend lines in analyzing the risk/reward dominos with earnings plays.
Aside from the speculative juices in earnings, Bitcoin is the ultimate risk-on vehicle.
Bitcoin shows a weekly Charlie’s Angels sell signal: 3 weekly “tails” in close proximity.
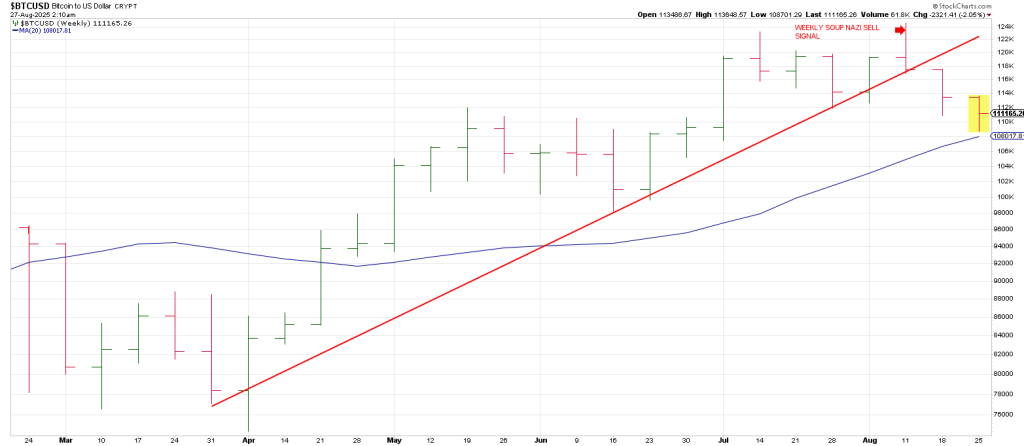
In other words 3 weekly signal reversal bars including the week of August 14.
Bitcoin broke weekly trend (the red Bottoms Line) to test its 20 week MA for the first time since May.
It’s 3 Week Chart turned down on the week of August 4 which powered a spike to all-time high of 125,000.
However, Bitcoin immediately reversed from that record high triggering a weekly Soup Nazi sell signal on the reversal thru the prior high.
Breakage thru the prior 3 Week Chart low (the week of 8/4) triggered a Time Turn Trend sell signal.
Pulling the lens back shows Bitcoin is flirting with initial support which if broken should magnetize price to the 75,000 to 65,000 region.
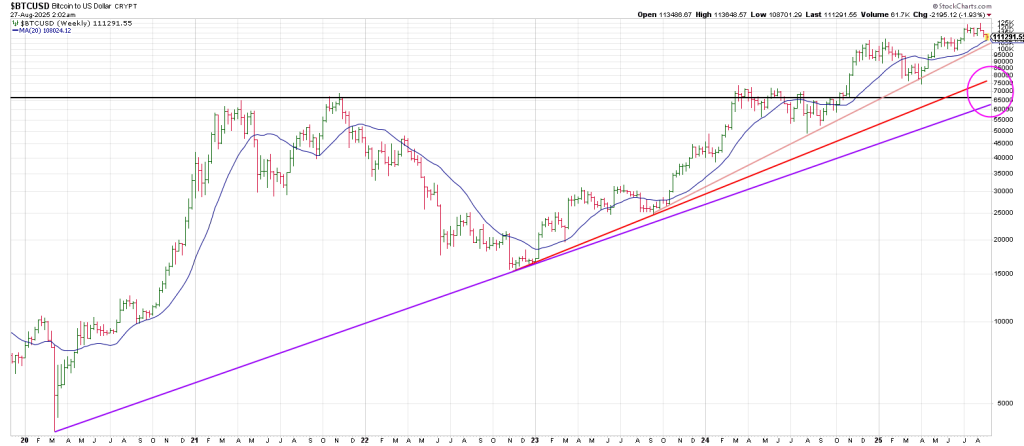
As you can see the breakout from last fall essentially perpetuated a double.
The Square of 9 Wheel shows that 125 (125,000) is 180 degrees straight across and opposite the early April Bitcoin low.
The date of the low “points” to the price of the high in this case.
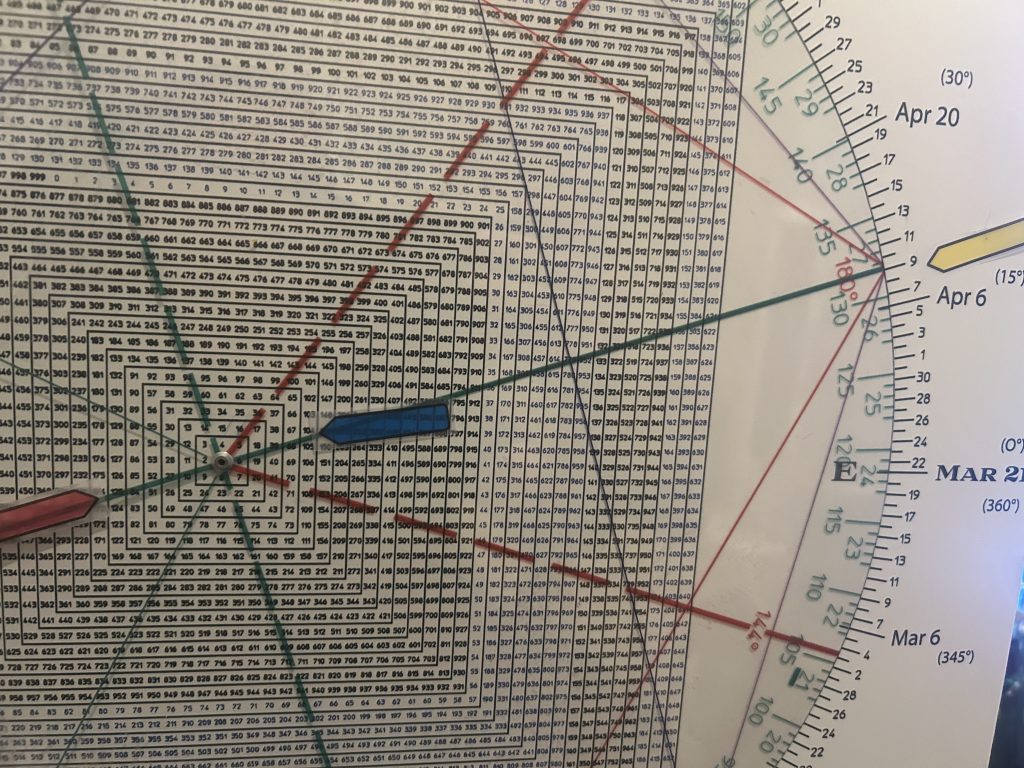
180 degrees down from 125 is 104 (104,000).
Bitcoin hit a low of 109,000 this week. It will be important to observe its behavior should it test 104,000.
While Bitcoin pulls back, GLD rallies.
GLD peaked at our 315-320 projection in April and has been going sideways since.
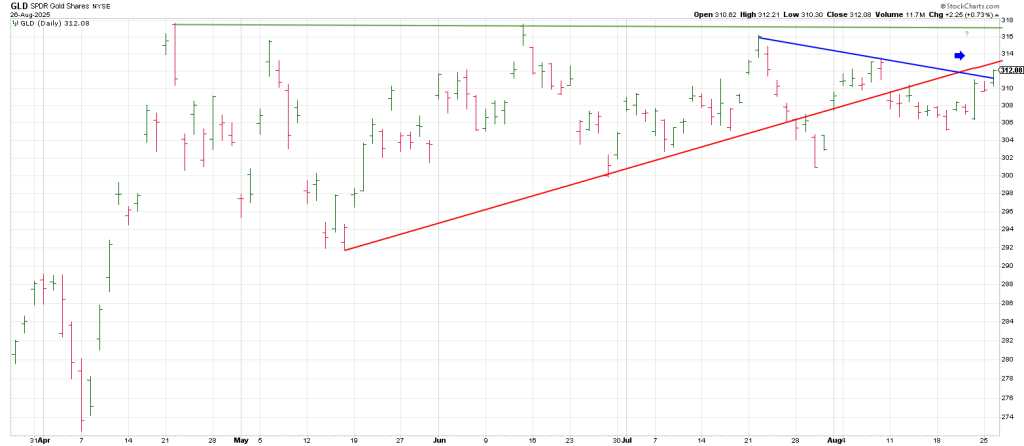
Yesterday GLD cleared a short tern trend line from July 22.
However, just above is a Ghost Line (red) from the May low at 315. Clearing 315 opens the door to
318.
320 squares-out with Friday.
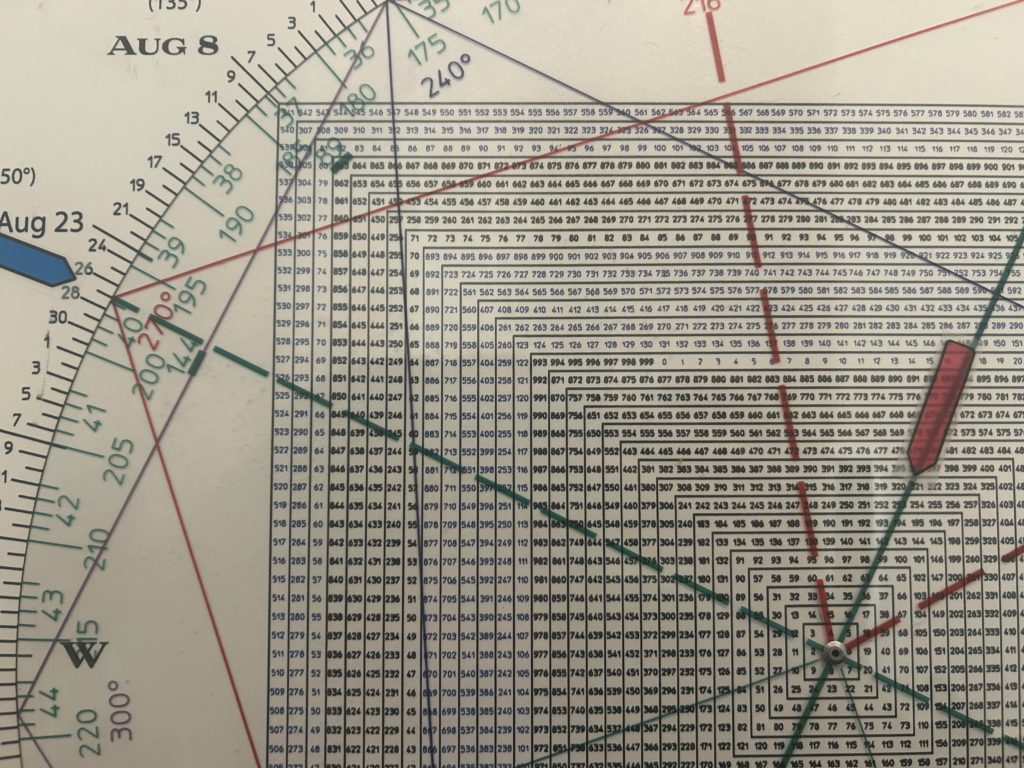
While GLD has been sideways for four months, the miners have been playing Ketchup.
GDXJ hit a 12 year high this week.
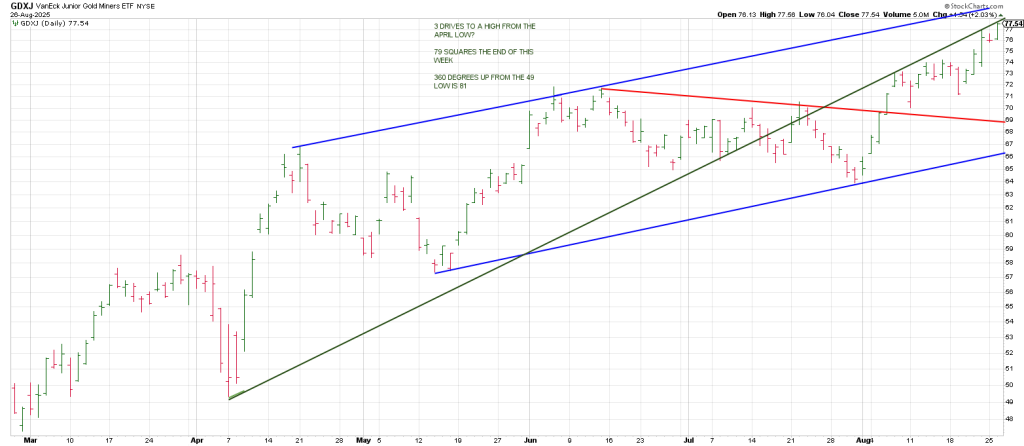
The convergence in this price region in August/September where gold has struck historic highs for example 14 years ago in 2011 warrants caution.