“But I came back again” “I’ll Be Back” The Beatles
“Stocks don’t move, they are moved.” Jack Cooper
William Durant dominated the greatest bull market of pre-World War 2 days—that of the 1920s.
Durant was a rich man in 1905, broke inn 1910, owner of General Motors Company in 1915. He lost his 90 million fortune in 1920. By 1924 he had again amassed 20 million.
On entering the business world with no money, he borrowed $1.000 and with a friend founded the Durrant-Dord Carriage Company in 1886. This venture prospered and soon became the largest carriage company in the world.
In 1903 he organized Buick Motor Company. In 1908, immediately following the 1907 panic, he formed the General Motors Company and in the next two years purchased Cadillac, Oakland, Oldsmobile and several other companies. Profits rolled in so rapidly that Durant was freely offered high credit for expansion of his concern.
In 1910 the bankers of the country faced panicky conditions and his credit line was withdrawn.
As a result General Motors passed from Durant to the bankers and he had to start all over again.
He did so. He organized the Chevrolet Motor Company and when it began to return sizable profits in early 1915, he did an amazing thing. He offered General Motors stockholders the opportunity to exchange one share of General Motors for five shares of Chevrolet. He also went into the market and bought General Motors stock, advancing it from $24 a share to $558.
A 20 bagger.
By October 1915 he had full control of General Motors. By 1920 Durant had accumulated a fortune of $90 million. Then General Motors launched an expansion program which Durant strongly opposed.
In the midst of the expansion, with the company $200 million in debt, the panic and depression of 1920 hit the U.S. Durant tried various methods to bail the company out, but they all failed and his entire $90 million was swept away in the process. On December 1, 1920 at 59 years old, he walked out of General Motors. A month later he organized Durant Motors. He also created somewhat of a sensation through his operations in US. Cast Iron Pipe in the early 1920s. In 1929 Durant pledged to pay back to original investors any money they had lost in Durant stock.
His leadership in the great bull market of 1924 to 1929 was stunning. He threw his own millions into bullish operations, and many millions more provided to him by the greatest pool ever organized, composed of 25 multi-millionaires. Under his personal direction he bought for the pool, in 1920 alone, more than $1,250,00,00 in stocks, while the partners of the pool invested two to three billion in addition on his advice. By 1928 this giant pool came as near to being THE market as anyone probably has ever been.
Remind you of the Mag 7? Doesn’t the circle of buyers that control Mag 7 like Blackrock, Vanguard and State Street really operate like a pool?
Durant’s approach was bullish and logical. The market was so huge that it was impossible to lead the advance with a single stock. It became necessary to plug up all the holes throughout the list and that is just what Durant did. Stocks doubled and even tripled at his hand.
Many market participants believed, the stocks were going up because their valuations warranted it on the promise of their growth prospects. Others were just speculators.
At the end of the day it’s always about positioning and sentiment in the near term.
In the long run, it’s about cycles and math.
One night in April 1929, a taxicab pulled up to the White House. Durant was ushered into President Hoover’s office. President Hoover, a New York business man, like Trump.
Durant warned the President that the worst panic in the country’s history was developing.
He advised the President that the crisis would hit if the Federal Reserve Board did not reverse its newly adopted policy of curtailing brokerage loans and security credit.
The Federal Reserve did not change its policies and the following month in May 1929 Durant sailed to Europe and the pool started to unload.
Despite a last ditch hurrah into late August, the withdrawal of these funds was a blow from which the market never recovered.
This is why we must watch the charts to look for signs of big distribution under the surface, the real trend, despite the headline prices and record highs.
Despite Durant’s warning to Hoover, the crash ruined him. Perhaps he bought into the summer blow-off in 1929, thinking he had been wrong.
Durant, known as the “Bull of Bulls” was a visionary. At the end of WW2 Durant predicted an economic boom and that the possibilities for consumer goods were almost limitless.
By the time of his death, in 1947 the Durant’s were bankrupt and had to sell off most of their collection of paintings to pay for his medical expenses.
It’s buy the dip time again. The market came back—again—just like Durant.
But his story has a valuable lesson.
On Friday, we got another Powell Pivot.
Economist David Rosenberg believes Powell’s statement suggests a sequence of rate cuts not a one-off. Other’s believe it’s just a tweak in Fed policy. Rosenberg goes on to say that the July Fed staffers notes of increasing employment slack will run throughout 2027.
Translation— for the moment Powell is saying that tariff inflation is not going to feed into wage increases.
Unemployment increases throughout 2027 sounds like recession to me.
Despite three more big economic numbers before the September Fed meeting, the market jumped the gun it its typical ready fire aim pattern of behavior.
As offered on Thursday, $2 trillion of options expiring on Friday would cause a snowball effect whichever way the market moved.
The market had already discounted a September rate cut but on Friday morning the buy-side-horses were snorting at the starting gate knowing the trigger was coming.
The futures has been down 25 points Thursday night. The SPX was up 20 points ABOVE THE KEY 6400 SQUARE before Powell came to the podium.
6400 is 90 degrees down from the recent all-time high of 6479.61 on August 13.
Remarkably the SPX rocketed exactly to 6478.89 on Friday closing at 6466.91
Just shy of a new closing high above the 6468.54 August 14 closing high.
On Friday, March 6, 2020 and Friday, March 13, 2020, there were option expiration squeezes.
From a low of 2901 on March 6th the SPX exploded 85 points.
The following Monday saw the index gap down 110 points to 2864.
It kept on going reaching a low of 2734, a stunning drop of 238 points.
On Friday March 13, another option expiration squeeze occurred.
The SPX gapped up 90 points from the prior days closing low of 2480
And continued to rip to close on its high of the day, up 230 points.
And these squeezes played out in the middle of a pandemic.
Once they put the hook in they pull the fish all the way up to the back off the boat.
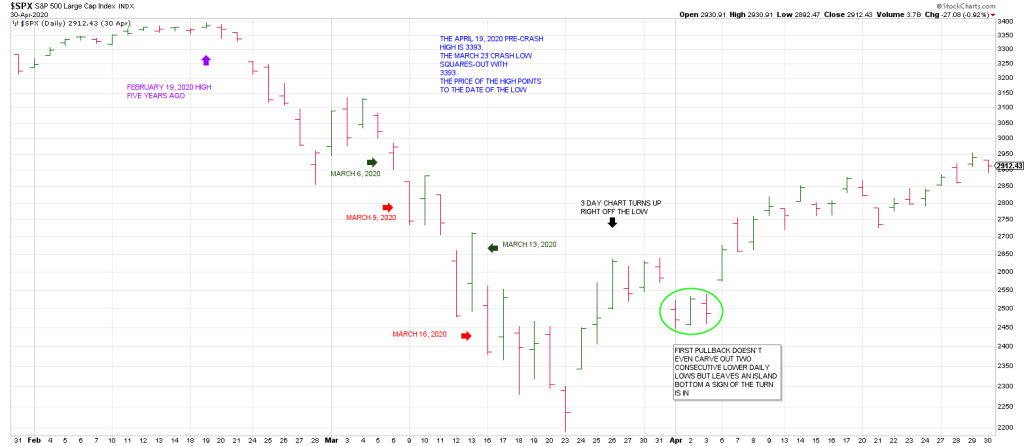
Interestingly the pre-crash high in 2020 was February 19.
The pre-crash high in 2025 was February 19.
5 years.
We’ve showcased the importance of the 5 year cycle many times in this space.
1924 to 1929 Roaring Bull
1932- 1937 bull run
1982 low to 1987 pre-crash high
1995 impulse to 2000 peak
2002 low to 2007 peak.
It will be interesting to see what this 5 year period from 2020 to 2025 produces.
The low in 2020 was March 23 versus April 7 in 2025. A two week offset.
September 2, 2020 capped an 8 day runaway move from August 24th.
Obviously September 2 rhymes with the Sept 3 record high in 1929.
From the Sept 2, 2020 high of 3588 the SPX dropped to 3209 in three weeks.
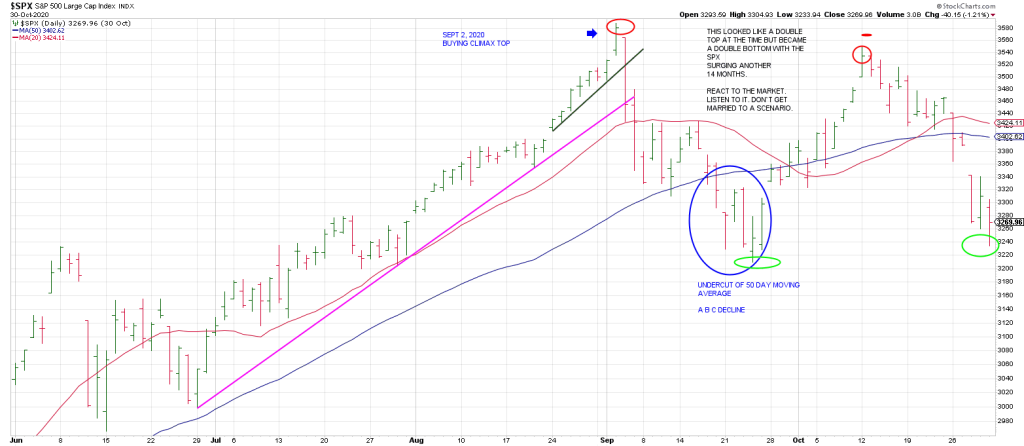
The downdraft undercut the 50 day moving average but came back with an Island Bottom perpetuating a rebound nearly all the way to the Sept top.
It looked like a double top with a Breakaway Gap back below the 50 DMA in October..
But it became a double bottom with the SPX surging another 14 months.
The moral of the story is react to the market, listen to it, don’t get married to a scenario.
The price action threatened a double top, but cycles were still up from the March 2020 flush-out.
The quick 10% drop in Sept 2020 respected one of the biggest anniversaries in the market, the August/early September anniversary dates.
1929
1987
2000
The 71st anniversary of the 1929 top was one of the factors prompting me to state in my report for August 30, 2000 that, “the most speculative area of the market, the NAZ, is in a similarly dangerous position as the DJIA at the end of August 1929.”
A monthly NAZ shows it close for the month of August 2000 tested the low of the March 2000 peak.
August was a Secondary High.
From that high of 4080 the NAZ dropped to a low of 795 in October 2002 — mimicking the 1929 crash.
So we have the 5 year cycle on the table in tandem with the big late August cycle.
This geometry of this 5 year cycle is compelling as the mid-point of 2 ½ years ties to the October 2022 bottom.
It will be important to see if the SPX carves out a double top.
This 6480 region is critical as it is 360 degrees above the February high and we are 180 days/degrees from the Feb high.
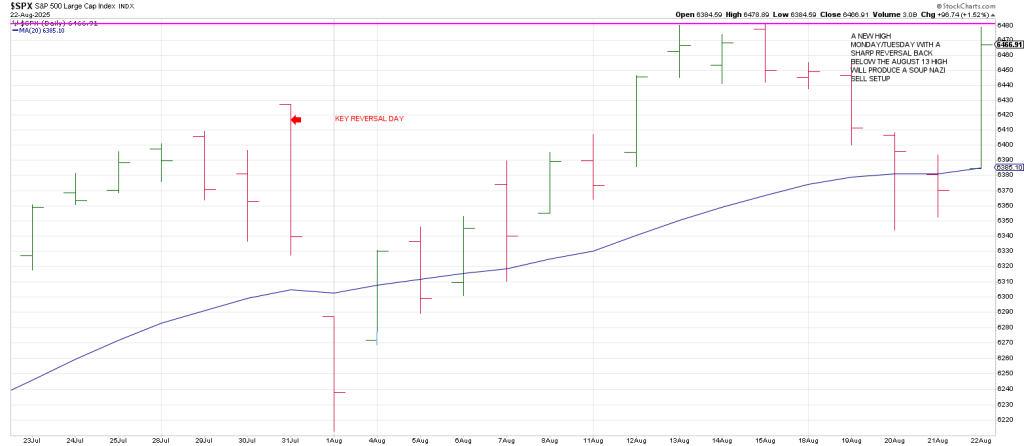
Heads up for a possible new high and a sharp reversal today/tomorrow below the August 13 high.
That would trigger a Soup Nazi sell signal.
Alternatively, if we get above this 6480 level and follow thru the next 90 degree decrement up is 6561.
180 degrees up is 6641.
270 degrees up is 6724.
360 degrees up is 6806
Interestingly 680 (6800) is 180 degrees straight across and opposite October 29.
For the past year I’ve thought there was the possibility of a mirror image foldback to 1929 playing out.
If we get momentum above current levels the door may be open to a run into the end of October.
As you know the year 2025 squares out with August 8 and November 7..
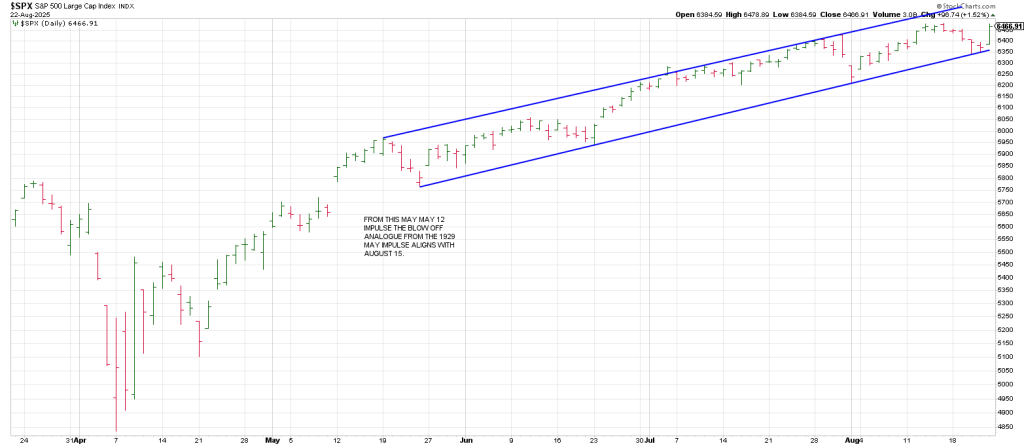
In sum, it will be critical to see if we get follow thru from Friday or a reversal back thru the August high especially as the mid-August peak perfects the calendar day count of the blow-offs in 1929 and 1987 (using the May 12 impulse).
Upside follow thru opens the door to late October/early November.
Roadmap for Monday August 25
A very choppy session following Friday’s straight line move.
A rally into 10:15 and a sharp downdraft into 1-:45
Give way to another rally attempt that looks like an A up B down C up
Into 11:45
From there a choppy decline into 12:3-1:00
Another rally is indicated from 1:00 into 2:15 followed by a giveback/consolidation into the close.
One possible Inversion Pivot at 11:45
Last week the market was choppy and bearish setting up a trap: a few hours rally on Friday morning as soon as Powell opened his mouth, the market erased one weeks loss in less than 2 hours.
The market erupted before the words left Powell’s mouth.
You draw your own conclusions.
NVDA is set to report earnings on Aug 27 after the close.
My expectation is the market peaks either on Tuesday or Wednesday.
It is a short-term top with a correction to follow.
Post NVDA earnings I do not expect a crash, rather a correction. It should be choppy and wipe out all call and put positions