“When you want something, all the universe conspires in helping you to achieve it.” Paulo Coelho
First, let’s review the Roadmap for Tuesday.
Then we’ll see what it has to say for today.
Below is the post for Tuesday’s Roadmap.
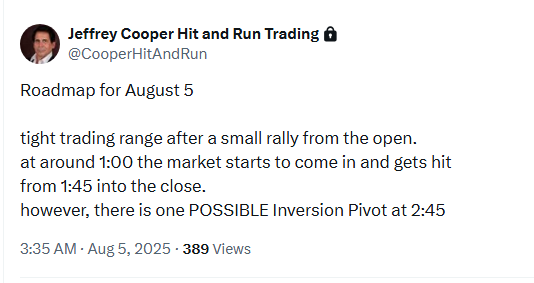
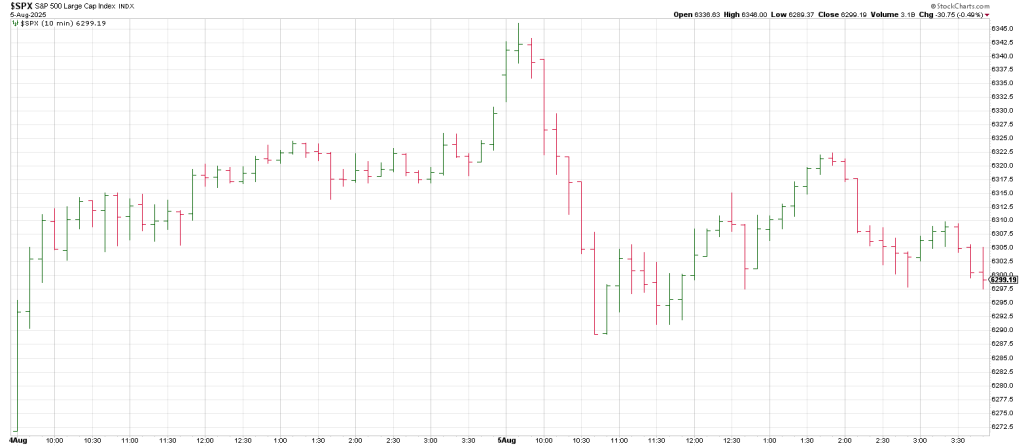
Here’s a 10 min SPX for Tuesday.
The forecast for Tuesday was a down day.
We had a small rally from the open.
The opening rally proved to be the high of the day.
The SPX did not hold up until 1:00. Instead the cycles that pointed to a down day for Tuesday
Exerted their influence in keeping with a down ORB and a Jump the Creek sell signal—breakage below the opening gap.
The SPX rebounded into exactly 1:45 and got hit again, selling off into the close.
The factors that go into the Roadmap don’t always dial in so tightly…in markets anything can happen… but I am amazed by it.
As well, I think the early rally that defined an opening high led to a sharp immediate downdraft versus a consolidation into 1:45 because of the dailies.
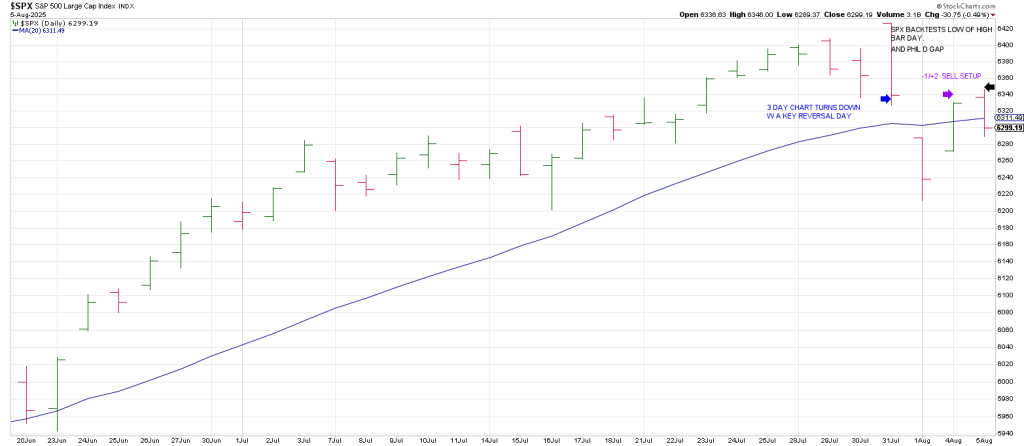
What I mean is that the SPX went into the Minus One/Plus Two Sell position as soon as it traded above Monday’s high.
To recap the Minus One part of my Swing Method is the 3 Day Chart pointing down. The Plus Two is 2 consecutive higher daily highs when the 3 Day Chart is pointing down.
Sometimes the market holds up on day 2, sometimes as soon as it “assumes the position”, it buckles.
At the same time the index satisfied push into Phil D Gap…the Breakaway Gap from Friday.
Hence, we bought puts.
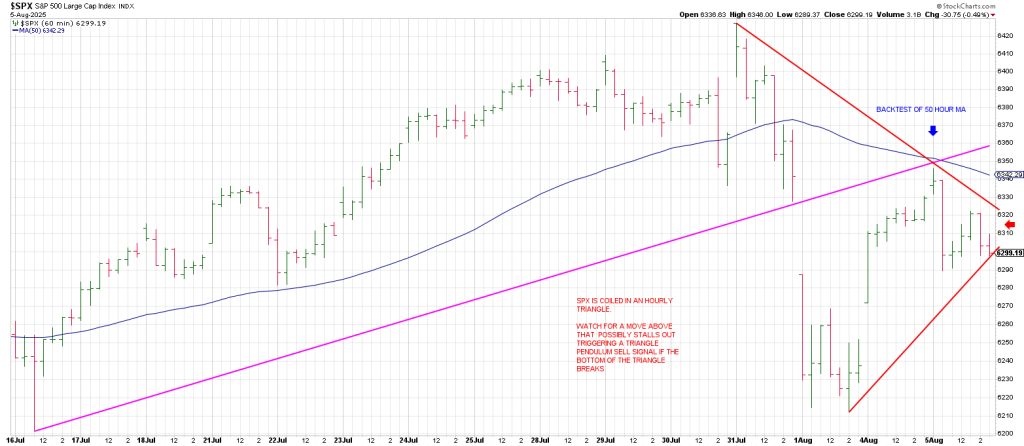
Additionally right out of the gate, the SPX backtested its DECLINING 50 hour moving average Tuesday morning.
Multiple time frame analysis puts you ahead of the game.
All trading is contextual. Signals on the 10 min and hourly are in the context of the dailies and the dailies are in the context of the weeklies, etc.
Below is a daily SPX showing the Minus One/Plus Two sell setup and the kiss of the low of the high bar day—the large range Key Reversal Day.
Below is an hourly SPX showing the backtest of the 50 day ma and Phil D Gap
In sum there was an array of technical producing Tuesday’s sell day.
Let’s review the squares down from the all time high of 6427.
90 degrees down=63.46
180 * down = 6266
270* down = 6187
360* down = 6109
540* down (a cube-out) =5953
Remarkably, 5953 ties to the 5945 low where the last leg up stated on June 23rd.
In other words if you took the price of the day before the June 23 large range reversal you nailed the high.
The June 20th Friday low before the impulse higher on June 23 was 5952.56.
You can’t make this stuff up.
Yesterday we discussed the potential significance of the 43 year span from 1932 to 1975 (low in Dec 1974) and the 1982 low to 2025.
That 1982 low was on August 12. We know how important anniversary dates were to W.D. Gann.
The last major bull market top was July/October 2007.
The SPX got slammed around 12% from mid-July into mid-August (anniversary again).
IF the SPX were to mimic that slide, it would take us down to 5650 region.
There’s nothing to say that pattern has to repeat, but it is 18 years and the Rahu/North Node cycle.
Tomorrow we’ll delve more deeply into the comparison.
That said, it would seem a bit pat.
If the 2007 to were going to be mirrored this year, it is possible that the spring plunge into April fits the July-August waterfall in 2007.
That would mean that the recent “breakout” to a record high was a Bull Trap rhyming with the Bull Trap in October 2007.
We’ll look at that closely tomorrow.
In sum last week we stated that following the Key Reversal Week the normal expectation would be to see 3 to 4 weeks of pullback and at least 2 weekly lower lows if not 3.
Did you notice on the above line-up of the degrees down from last weeks record high that 360 degrees down is 6109.
The record high in February before the sell-off is 6147.
IF we get a 360 degree pullback that holds the prior high…especially if it happens within weeks, that could theoretically produce a last ditch melt-up.
Similarly the plunge this spring checked back to the January 2022 top of 4818.
If the February top should fail to act as support on a correction, it is more evidence a top is in.
Despite AMD getting whacked 11 points after the bell on earnings, the futes are UP as I write Tuesday evening.
The Roadmap doesn’t know what AMD is.
The Roadmap thinks we have an up day today as you know.
It projects a rally into 10:15 and a slight pullback into 11:00
From there another rally plays out into 12:00 where the market begins to rollover accelerating into 1:30.
A rally is projected to unfold from 1:30 with an initial spike up into 2:00
And a pullback to test the lows into 2:15.
From there a strong rally is indicated into 3:30 with the market goes flat into the close.
Despite yesterday’s SPX turndown from a Minus One/Plus Two sell setup, the Roadmap is looking for a rally day today.
It will be important to see the action if the 3 Day Chart turns back up on trade above Tuesday’s high today.
Tomorrow’s report will discuss what to expect if we get a new high over coming days triggering a Keyser Soze on trade above last Thursday’s big reversal day.