GLD pre-parabolic low was 150.50 in November 2022.
It was measuring fro that low that backstopped my projection last year for a run to 315-320.
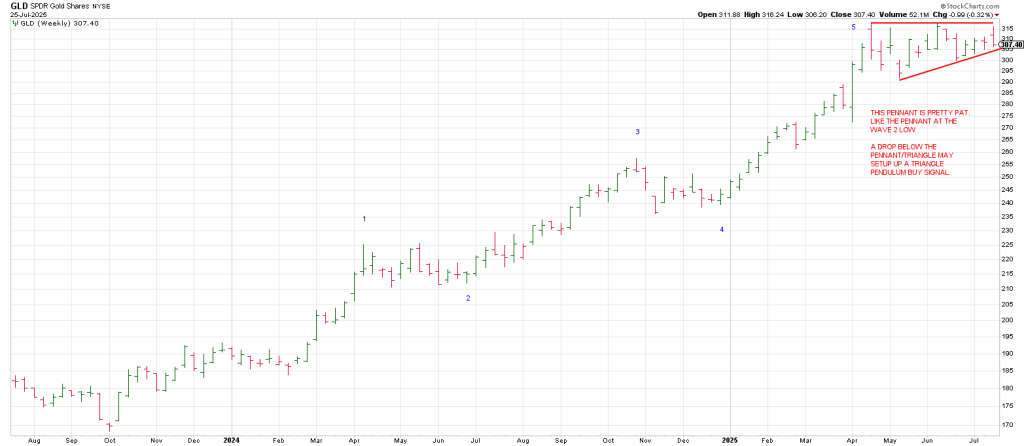
GLD struck a high of 317.63 in April of 2025.
How did I come up with that projection?
Well, 720 degrees up is 264. Another 180 degrees up is 290.
Another 90 degree decrement higher is 315 which is due north on the Cardinal Cross.
Seemingly it would have made more sense for me to have projected a full 3 revolutions up from 150.
Why did I stop 90 degrees shy at the 315 region?
It is because the low prior to GLD going vertical was at 236 in late October 2024.
360 degrees up from 236 is 301.
A 90 degree decrement higher is 319…almost a bulls eye as GLD struck 317.63 in late April where it left a large range weekly reversal. It has been sideways for three months.
GLD should attempt to satisfy 3 revolutions of 360 degrees from the 150 loq. That is 333. A Nicola Tesla special.
A drive to 333 also satisfies a cube out (540 *) from the important 236 low. That projection calls for 337.
July would be an idealized time for GLD to come out of its consolidation as it is 90 days/degrees from its April peak in the context of what looks like a Bull Flag.
GLD left a large range week to the downside last week after turning its 3 Week Chart up, so it has its work cut out for it if the breakout is on the table.
That said, clearing last week’s high would be a “fast moves come from false moves” pattern.
Breakage above last week’s high also puts in in a position to trigger a Rule of 4 Breakout.
Was has me concerned, if GLD should breakout, is that from its point of acceleration in Feb 2024, a clear 5 waves can be counted
The 5th wave from late December 2024 into April is the largest wave which is common for commodities…especially gold.

Consequently, if GLD should breakout of this triangle which is the strong likelihood, and exploded to the 333 region it may be a giant trap.
I guarantee you, if gold/GLD breaks out of this triangle, the world will be looking for 5000 next stop.
October would be an ideal time-frame for a peak if it breaks out as it is 90 days/degrees from July and October is 3 years from the October 2022 low.
Of course 360 X 3 (3 years) is 1080 degrees which is a key Gann Cycle. Some believe it is his Master Time Factor.
The has a radius of apx 1080 miles.
108 moons fit between the Earth and the Moon.
The Sun is 108 Suns away from the Earth.
But that is not what this is about.
For its part silver has been play Ketchup to gold—slow at first then all at once
We caught the SLV breakout on July 10th which saw it explode to new 13 year highs the next session.
The celebrating on Twitter that weekend was something out of Reservoir Dogs.
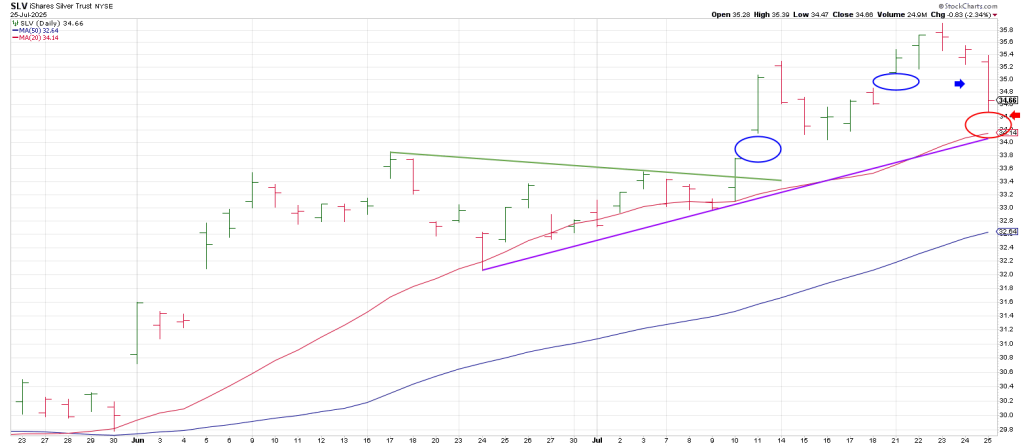
SLV had another up gap in its pocket on July 21st; however, Friday it triggered a Jump the Creek sell offsetting Monday’s gap.
The Breakaway Gap out of a consolidation is just below and ties to the 20 day moving average.
This would be the ideal place for SLV to make a stand.
Of course nothing silver does is pat or by the book, so it would not surprise me to see a flush out of the 20 day moving average and big breakout putting all the Silver Bros on their heels before the Silver Streak leaves the station in earnest.
I don’t think silver powered this far not to tag the all time historic highs at 49/50.
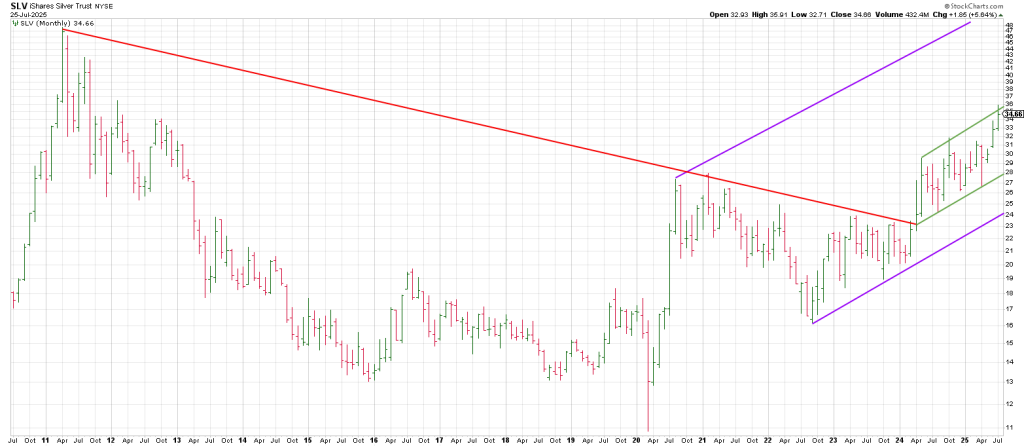
The major low in SLV for this advance was 16.19 is September 2022.
47/48 satisfies a 540 degree move…with September being 3 years of 1080 degrees/days forward.
Silver’s all time high was 49.45.
The 2011 high got virtually tested that high.
I get asked this question more than any: If stocks go down sharply won’t gold and silver?
Look at the action from the start of the year to mid-April. The opposite.
And if you thought the stock market recover would see the metals give up their gains. Again, the opposite.
Correlation Kills. But people love “if this then that.”
The market.
The SPX is flirting with yet another square-out at 641 (6410).
641 is opposite the week of the low in early March 2009.
It conjuncts early September, the top of the blow off in 1929.
It squares the 666 low from 2009.
Mid- August is interesting as it is 180 degrees opposite the important February pre-crash 2025 high.
As well Mid- August squares 483 (4835) the price of the low