“Did you ever wake up to find
A day that broke up your mind
Destroyed your notion of circular time.” Sway, The Rolling Stones
The new high in the SPX last week was 2.5% higher that the February high.
The equal-weight S&P 500 looks quite different.
The high in the equal-weight S&P 500 was 7589.91. That high occurred on November 29, 2024. The highest level reached this year is 7533.01 on July 10.
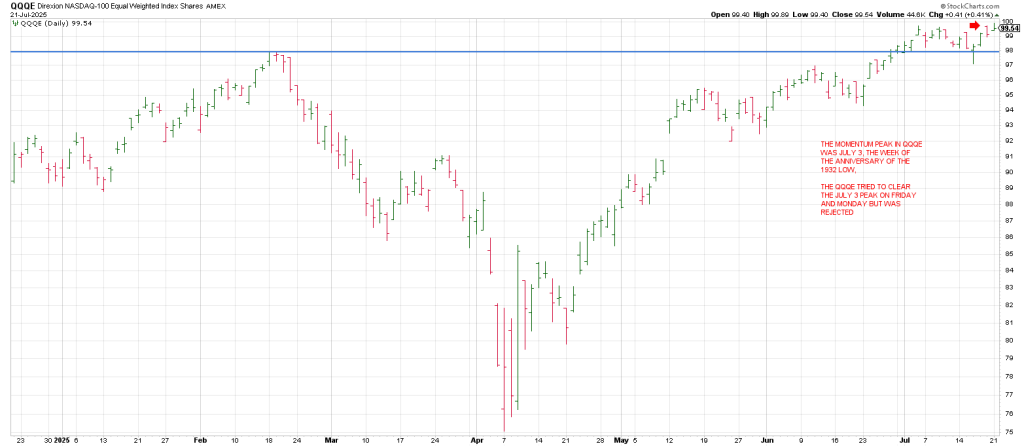
The QQQ closed Thursday 3.9% above its February high. The equal-weight QQQE closed just 1.5% above its February high, and that new high occurred on 7/3. The QQQE did not accompany the QQQ into new high ground last week.
However on Monday the QQQE struck a record high of 99.89 but that new high was rejected as it tailed off to close near session lows. It still eked out a record high close of 99.54, just 9 cents above its record close of 99.45 on July 3.
In so doing the QEEE left a second Soup Nazi reversal sell signal, albeit both barely on the drops below the July 3 peak.
Checking the monthly margin debt levels on the NYSE, the margin debt increased from April to May by $79 billion after declining for 3 months from a high in January. The high in January was $937 billion.
The previous high was $936 billion in October 2021; the NAZ averages topped out the following month, the NAZ fell 36.4%, the NEX declined 35.6% to a major bottom in December 2022.
The $70 billion month to month increase in margin debt from April to May this year was the second largest increase in the past 7 years since I’ve been tracking it. The biggest month to month increase was the $75.5 billion in January this year, just before the February-April stock market decline.
Because the NAZ is where speculation has been most pronounced and because the NAZ technical condition is awful, it is the NAZ averages that will take the whole market down when they finally let go.
From a technical viewpoint, I don’t see a happy ending.
We’ll delve into the divergences in tomorrow’s report.
An hourly SPX shows the index exploded to a July 3 peak, consolidated, and then tried a fresh breakout on July 17th after a shake out to 6200,
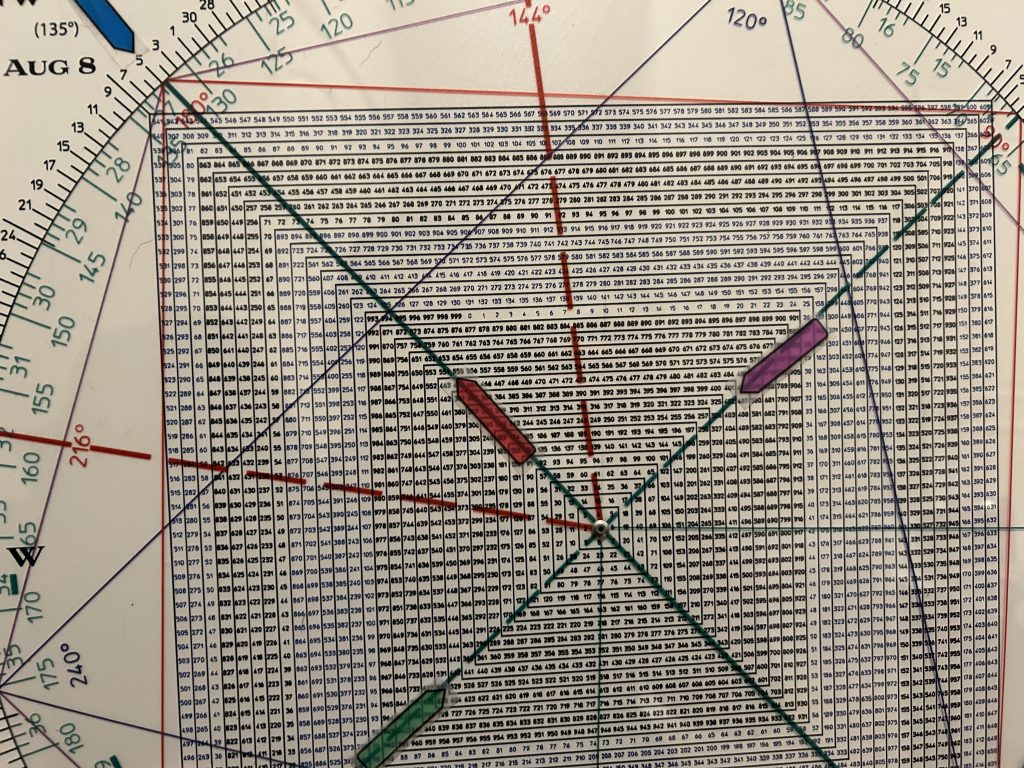
The SPX gapped up on Monday basically satisfying a possible Time/Price square-out at 6340.
Why? 634 is opposite April 7, the low.
Monday’s high was 6336
Maybe something, maybe nothing but there’s Nicola Tesla’s 3-6-9.
Indeed 6 33 6 mirrors 666, the SPX bottom in on 3/6/09.
If this turns out to be an important top, that will be some remarkable synergy.
The SPX hourly makes it clear where the pivot is that opens the down door.
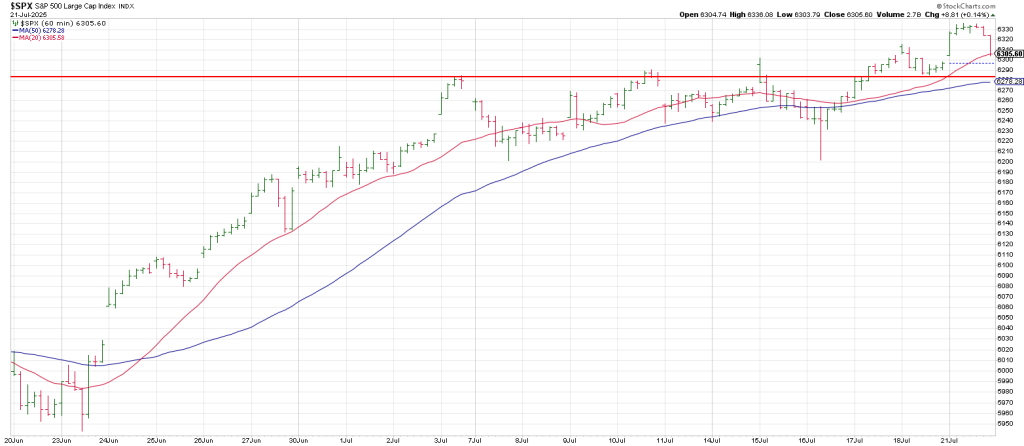
The SPX dropped into the bell to kiss its 20 hour moving average just above Monday’s open gap.
Breakage below Monday’s open gap is a Jump the Creek that opens the door to the Line of Most Resistance…the red horizontal “July Line Formation”.
That level ties to 6285 and the 50 hour moving average.
Below that I think opens the door to a full backtest of the prior all time high in February, 6147.
If it’s going to happen, it could play out quickly.
The Q’s have some synergy here with the late July/early August 2024 air-pocket.
The April 7 low on the Q’s is 402 which squares August 5, the flash crash low in 2024.
In turn, they square out with 554.
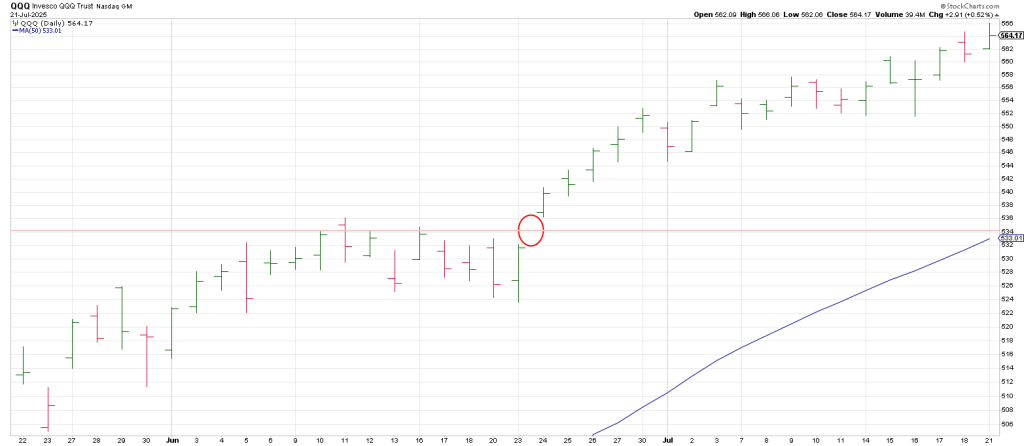
If 554 snaps, and we get a repeat air pocket, it is interesting that the next square-out level is 530.
This ties to the open gap from June 23rd and the 50 day moving average.
In sum, the open gap and the 50 day line on the Q’s in the 530 region may trigger the Rising Wedge shown yesterday magnetizing the QQQ to whoosh lower.
Keep in mind the Q’s are extremely extended from their 50 dma which has not been seen in nearly 3 months since it was reclaimed on April 30th.
Wouldn’t it be interesting if the 50 day line is tested going into the end of July…90 degrees/days since it was last seen?