“You don’t need a weatherman to know which way the wind blows.” Subterranean Homesick Blues
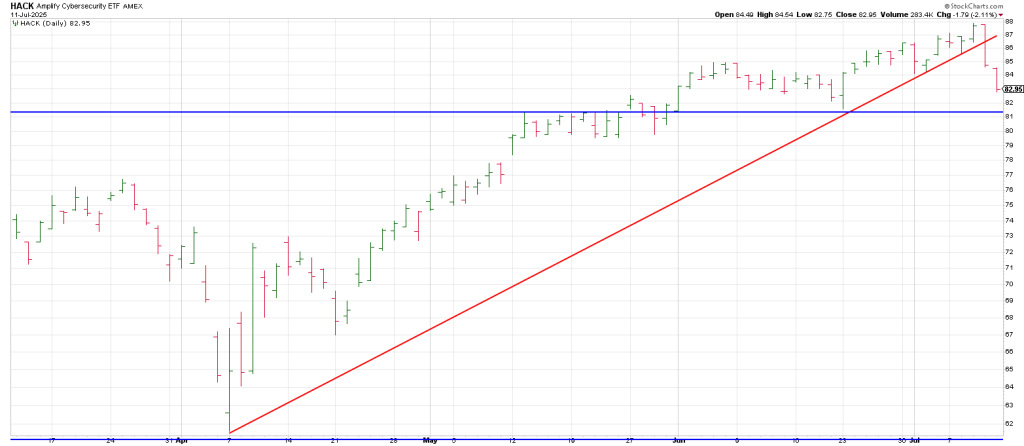
In our Friday, July 11 article, Several Tech Generals Flee Battlefield Sounds An Alarm, we focused on the importance of the action in the leaders pointing to the HACK ETF reversing from the test of a 3 point trend line connecting the Jan 2024 high, the Feb 2025 high and the High here in July.
This echoes legendary trader Jesse Livermore’s philosophy “As the leaders go, so goes the entire market.”
Or…to twist Bob Dylan’s lyrics, “Follow leaders, don’t watch the parking métiers.”
HACK was perched on weekly trend line on Thursday’s close and followed thru leaving a large range Key Reversal Week.
Here’s an updated weekly HACK
Notice the February top missed producing a Key Reversal Week by a fraction.
Nevertheless last weeks bar looks eerily similar to the large range signal reversal bar on the week of Feb 17.
Caution is warranted as clearly the possibility of a pattern of 3 Drives To A High is in play.
Is another test of the 50 week moving average on the table?
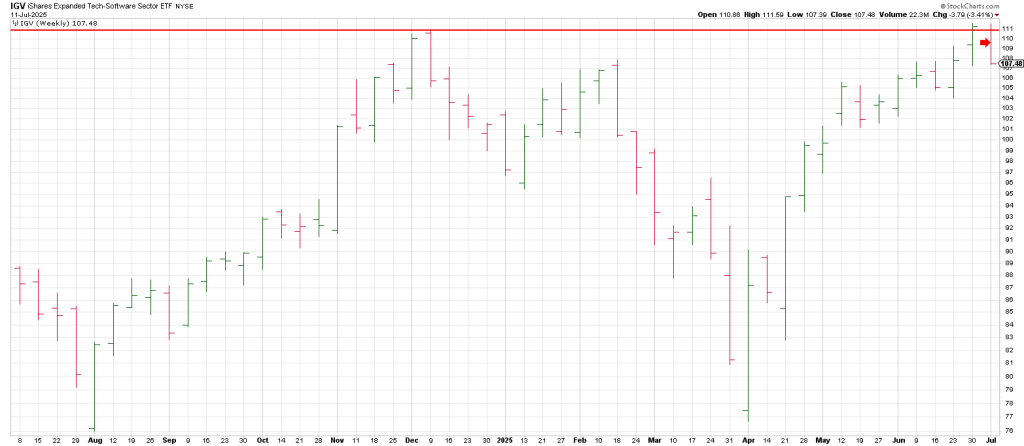
IGV is the Software ETF and was the other mega leader off the April low.
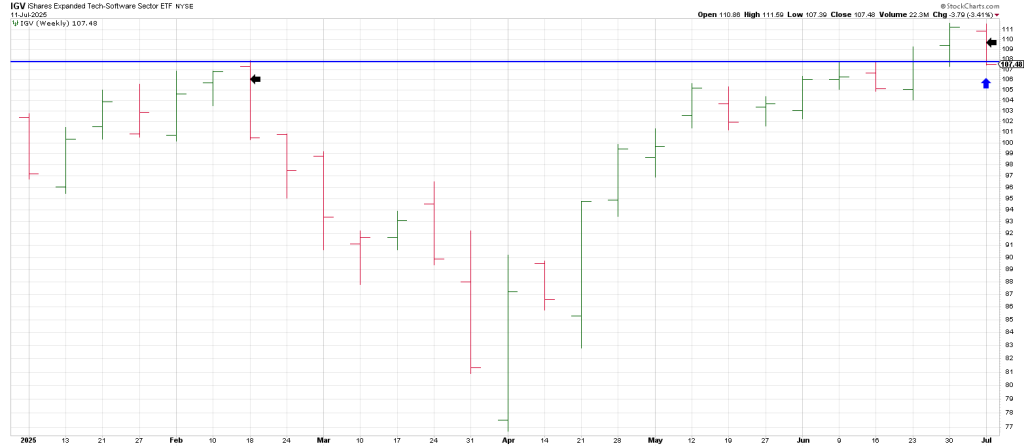
It left Bearish Train Tracks last week mirroring the bearish Train Tracks from its prior high in mid-December 2024.;
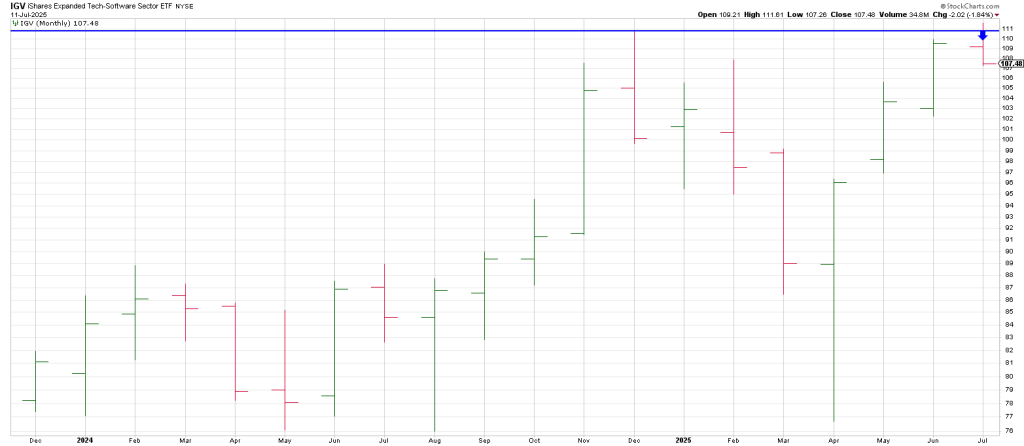
Turning to a monthly IGV shows a bearish Soup Nazi sell signal:
IGV made a new 20 period high, in this case monthly, and reversed immediately back below the prior monthly high from December 2024, with at least an interval of 4 bars dictated by my strategy.
The 4 bar interval is to guard against a continuation move versus a test failure.
The point is that both HACK and IGV could be putting in Secondary High.
Alternatively, the normal expectation would a meaningful pullback of 2 to 7 weeks.
With many leaders following thru to the downside Friday, it’s remarkable that the indices weren’t down more.
ORCL left a Charlie’s Angels sell setup (3 Tails in close proximity)
HOOD left a Topping Tail from a new 10 day high (a Lizard sell setup) as well as a Soup Nazi sell patter.
Hit and Run shorts ZS and CRWV for Friday followed thru to the downside.
But rotation keeps the market up like spinning plates on sticks…until it doesn’t.
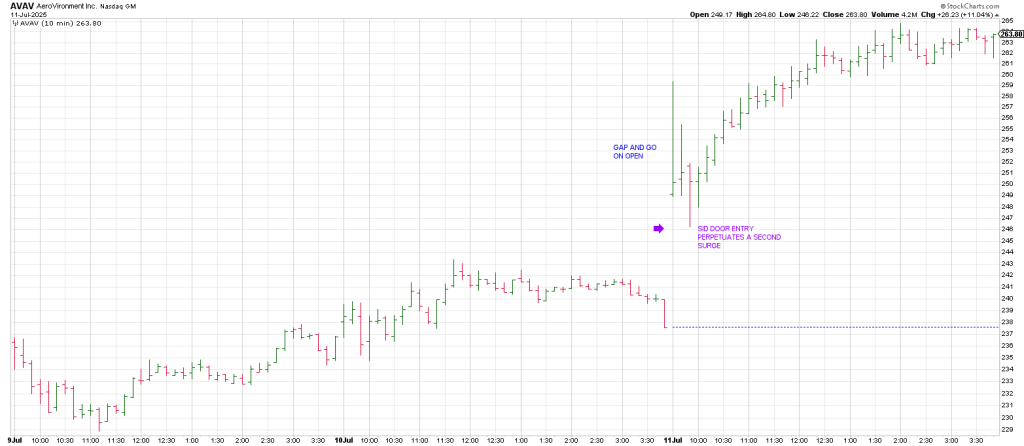
AVAV is the poster child for this weeks rotation.
We recommended it Thursday as a long ‘Overnighter’.
It exploded Friday.
A 10 min AVAV shows the open gap followed by a Side Door Entry.
My gut is the market rotation is producing a log of smoke; the tires are bald and it will be tough to get traction if the Q’s which have two consecutive lower daily lows get a third lower low turning the 3 Day Chart down —and it does not elicit a rally.
So today is pivotal as the Q’s could turn their 3 Day Chart down for the first time since June 20.
If the 3 Day Chart turns down and the Q’s continue lower, the door is open to the 20 day moving average.
Breakage below the 20 dma opens the door to the December Feb double tops and the open gap from June 24th.
Succinctly, the 532/543 region.
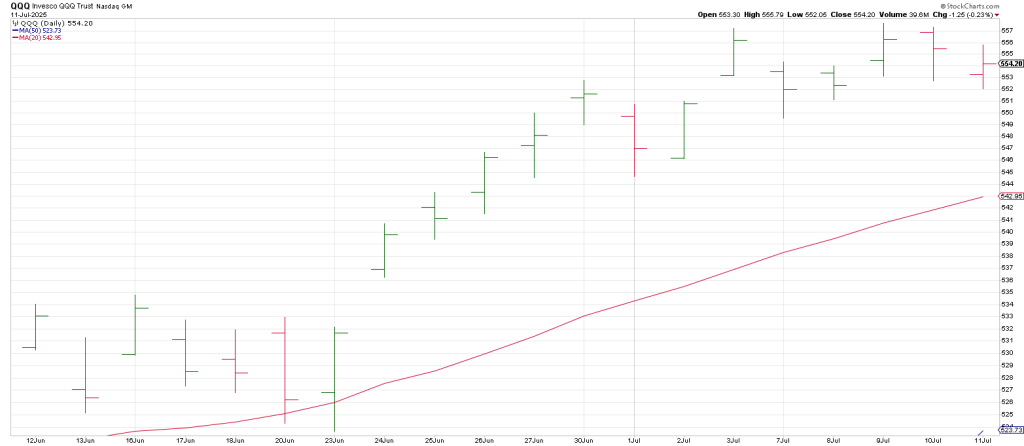
If the 557.63 high marked a top of some degree, here are the 90 degree squares down from that high:
90 degrees down is 534.
189 degrees down is 511.
Within the context of the cyber and software ETF the NAZ plowed higher last week striking a new all-time high.
That said it may be completing a 5 point Megaphone Top.
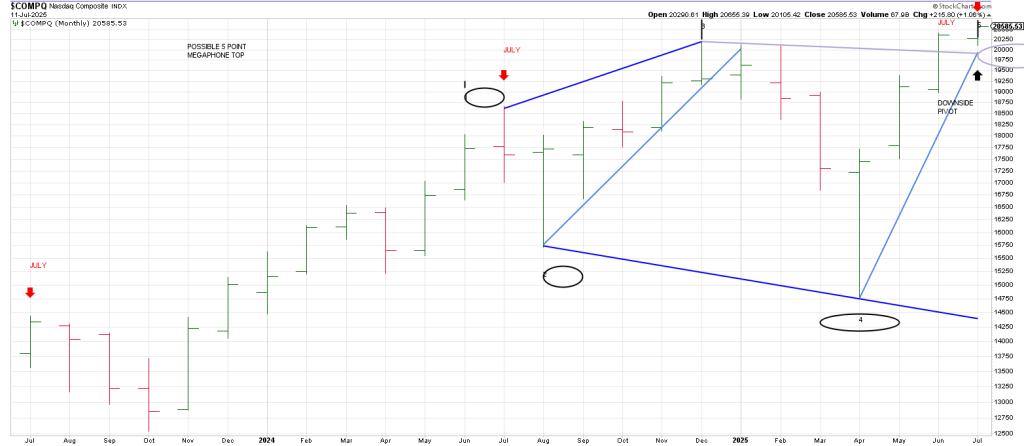
Markets often play out in ‘three’s’ and I can’t help but wonder whether after sharp selloffs the last two July’s whether the third time is a charm for the bears this July.
The downside pivot is around 19,800. This parallels the blue Bottoms Line connecting the August 2024 low and the April 2025 low.
It also ties to a line paralleling the rising trend line connecting the bottoms from August 2024 into the low of the December 2024 signal reversal bar.
Last but not least we have been positioned for a silver move by virtue of our AGQ long.
SLV telegraphed Friday’s surge with a Rule of 4 Breakout on Thursday, a breakout over triple tops.
Now what? With the exuberance on Twitter palpable, it would not be surprising to see a backtest of the breakout point after a push higher.
A daily silver shows an inverse Head and Shoulders with a projection to 32.
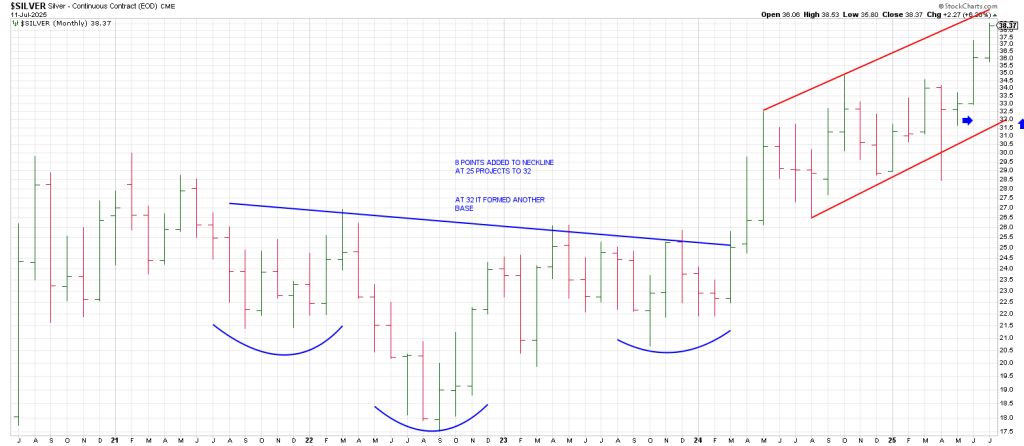
Silver built a base at the 32 region which became the lower rail for a rising Trend Channel.
The top of the channel ties to the 41/42 region.
360 degrees up from 17 is 35. Another 90 degree decrement high is 43 confirming the theoretical resistance in the low 43 region.
Let’s pull back the lens to the prior historic double tops at 48 from 1980 and 2011.
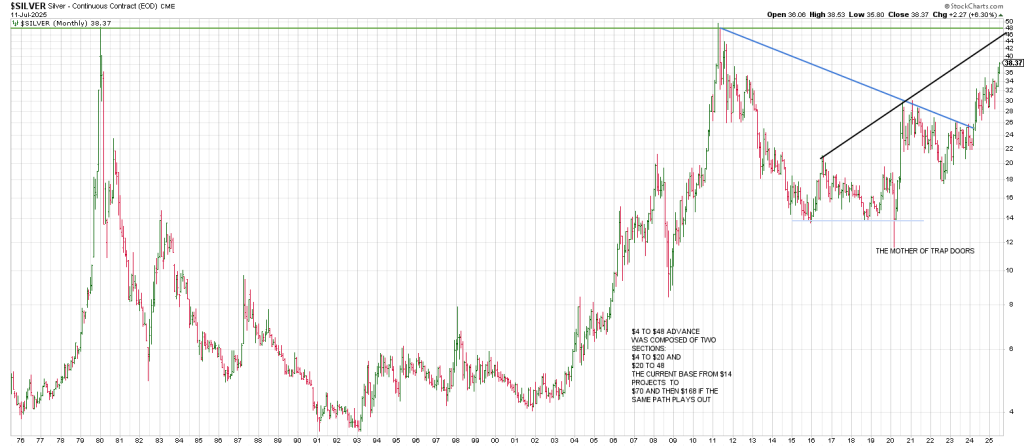
Silver triggered an Angular Rule of 4 Breakout in 2024.
A Ghost Line connecting the 2016 high and the 2020 high points to possible resistance around 45…basically a triple top.
My gut is silver sells off after spiking further pulling the rubber band back for an attempt at a massive Rule of 4 Breakout over the historic 48 tops.
The advance from 4 to 48 was composed of two sections: 4 to 20 and 20 to 48.
The current base from 14 projects to 70 and then to 168 if the same waves play out.
Tomorrow: Bitcoin.

Square of 9 Wheel
Purchase your own Square of 9 Wheel. Shipping to US only. Contact Jeff for shipping outside the US.