“When you’re on a golden sea
You don’t need no memory
Just a place to call your own
As we drift into the zone.” Island In the Sun, Weezer
There was a 17 year secular bull market from 1949 to 1966.
Currently we are in the 17th year of a bull market that started in November 2008.
2008 was the low for the NDX and many of the leading stocks.
It was the low around the world.
March 2009 was an Undercut Low.
This 17 year bull sets up as the last section of a 43 year bull market that started in 1982.
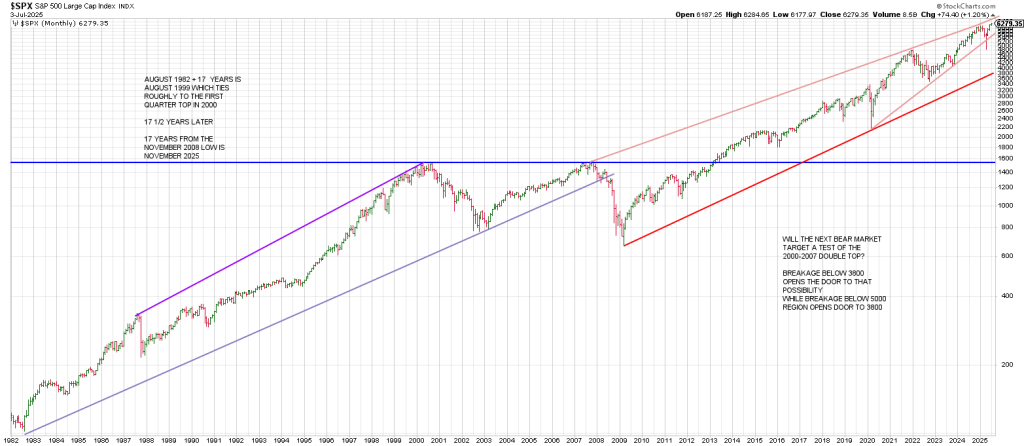
August 1982 + 17 years is August 1999 which ties roughly to the first quarter top in 2000.
(interestingly August 1999 was the primary high for the DJIA).
17 years from the November 2008 primary low is November 2025.
Will the next bear market target a test of the 2000-2007 double top?
Breakage below 3800 opens the door to that possibility while breakage below the 5000-5300 region opens the door to 3800.
On the Square of 9 Wheel , 43 squares out with November 7th.
As well, 43 and November 7th align with 2025, the year.
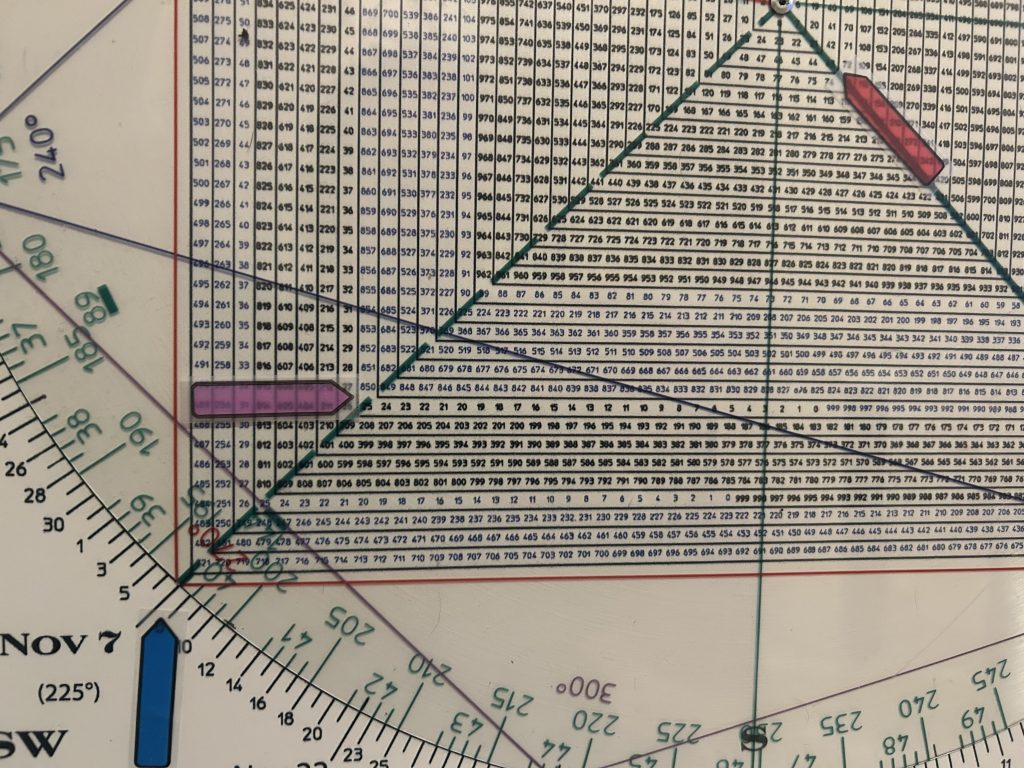
Interestingly 17 also squares out with 43 on the Square of 9 Wheel.
Happenstance?
My expectation is that November has the potential to be a major top…assuming the correction that I expect from this region is followed by a last ditch run.
That is assuming that an expected high in this region is not the major top.
If we get the correction I expect you can imagine many institutions that have fought the market since the spring crash will not hesitate to jump on the bandwagon. They can’t afford to be left behind again.
They may be reluctantly bullish at the moment.
If the market turns up again after a correction institutions will be aggressive, perpetuating a hyperbolic move on top of what has been a parabolic move from April 30th.
That was the day the SPX signaled it wanted to test the all-time highs.
April 30 was a large range outside day (LROD or Lighting Rod) to the upside that telegraphed a recapture of the 50 day line…which occurred the very next session, May 1.
The 50 day has not been tested since.
The surge from April 30th ran until May 19th where a pullback played out.
It was expected as it was a geometric 90 days/degrees from the February 19 peak.
On May 19th the SPX was stretched 340 points above its 50 day line.
Why do I expect a correction from early July.
Currently the SPX is stretched 397 points from its 50 day line. Greater than at the May 19th peak.
In fact, the SPX is more stretched above its 50 day line than at any time since the bear market rally high on August 16, 2022. That ‘stretch’ perpetuated a reversion to the mean of 834 points or around 9% in 3 months.
We have been pointing to the July 7th time frame for a few weeks as it is 90 days/degrees up from the April 7th low.
The SPX low in April was 4835 (484).
540 degrees up from 484 is 624/625.
In other words 625 cubes out the April low.
The SPY closed at 625.34 on Thursday.
That said the SPX struck a high of 6284.
In percentage terms that is a fraction over the idealized level of 6250 (625).
What’s stunning is that 625 also aligns/vibrates off the aforesaid November 7th time-frame.
Last week in the article “The Advance Dwarfs the Roaring Twenties, I drew some analogies to the blow-off in 1929 to the current run.
From May 31, 1929 to September 3, 1929 the DJIA advanced 33.12% in 95 days, reaching a high not seen again for 26 years.
From April 7, 2025 to July 3, 2025, the SPX advanced 29.98% in 87 days.
The 1929 numbers are from close to close (May 31 and Sept 3) as we don’t have highs and lows for those days.
The 2025 numbers are from the low of April 7 to the high of July 3.
If the synchronicity from last weeks report exerts its influence, it is not unreasonable for a potential correction in July to turn out to be the final blowoff peak. We have no clear way of knowing that until we look back of course, but at the end of this piece, I present downside signposts that will tell the tale.
Assuming July does not mark a major top, I can’t help but wonder if the pattern from 2007 is in play.
The SPX struck an important high on the week of July 9, 2007 at 1555.
It dropped to 1370 by mid-August.
A 12% decline.
A similar 12% sell-off from current levels projects to 5530.
Following the plunge into mid-August the SPX exploded again into October for the final top before the Great Financial Crisis.
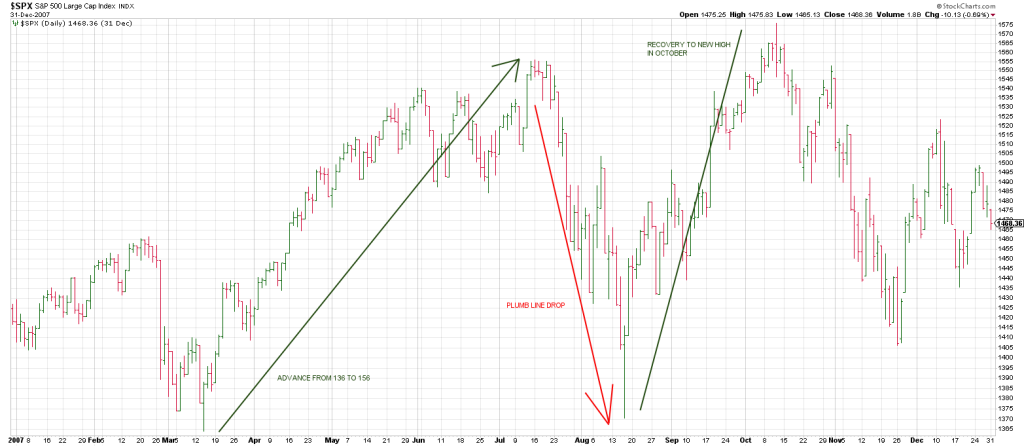
A correction from July 2025 into August followed by a final runup into October/November is in keeping with the time/price synergy for a November top described in last week’s piece “The Advance Dwarfs the Roaring Twenties.”
A few weeks ago I suggested that a pullback to the 5500 region could put in the Right Shoulder to an inverse Head and Shoulders pattern.
If that plays out and we then get a rally that takes out the current highs (a Neckline) the ensuing projection for a run for the roses equates to 6790 ish.
Interestingly, this ties to 9 revs of 360 degrees up from the 67 SPY low in 2009 which is 684 (6840).
The bottom line is:
1) Clearing this 625 SPY region opens the door to the 6800 region. The presumption is that we get a meaningful pullback first from around current levels if that is going to play out. If the structure of that presumed pullback is corrective (3 waves down) then we should be looking for a buyable low.
If the structure of a presumed pullback from around current levels is impulsive (5 waves down), it is a likely signal that the bull market has finally topped.
2) How will we know that pullback has begun? Thursday the market gapped up. Breakage below that open gap at 6246 that sticks is the first signal a correction has started. The futures are down 43 from Friday. If that hold into Monday’s open that is translates to an open below 6246.
I am writing this on Sunday morning so I don’t know where they are on Sunday afternoon yet.
However, if we gap down below Thursday’s open and stick, we could have an Island Top in place. This underscores the idea of a correction with Thursday being a possible Exhaustion Gap following a 9 day sprint. From the June 23rd outside up day off a test of the 20 day moving average the SPX has not traded below a prior days low. This qualifies as at least a short term blow off.
3) Downside follow thru at any point below the prior all-time high of 6147 is a further warning of a false breakout and exhaustion. And we know that fast moves come from false moves; consequently, breakage below the 6147 February high with FOLLOW THRU could elicit a sharp down-draft.
Further confirmation of a correction in progress will be offsetting the open gap from June 24. That gaps is from 6028-to 6059. So it is roughly 100 points below the 6147 Feb high and a Phil D Gap failure below the 6028 warrants caution.
In sum, we have two gaps on tap to watch: the first from Thursday at 6227, the second from June 24 at 6028.
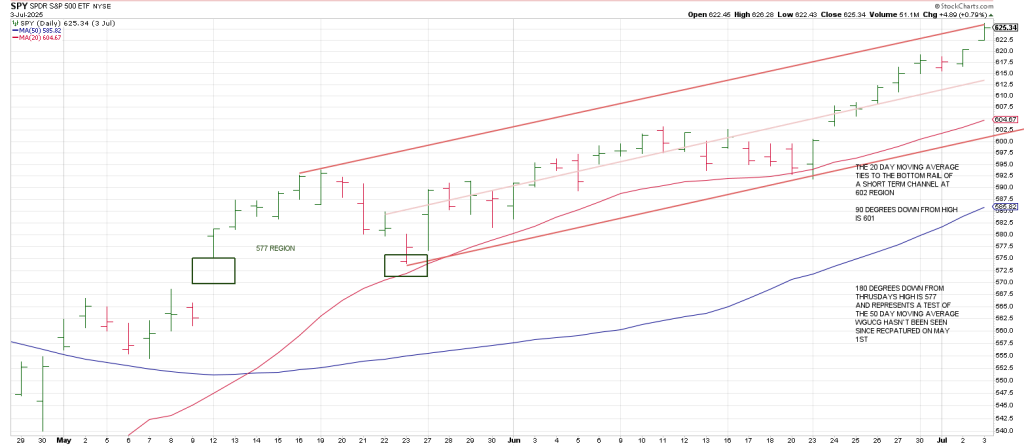
On Thursday the SPX spike to the potential 625 square-out coincides with the kiss of the top of a near-term trend channel.
The key open gap at 6028 ties to the bottom of the trend channel as well as the 20 day moving average.
90 degrees down from Thursday’s high is 601. So we have a strong confluence of support at this 601—603 region.
Again, this is below the February peak. Not all well-defined support levels are created equal.
180 degrees down from Thursday high is 577 and represents a test of the 50 day moving average (flagged above).
Conclusion. A break of 601 SPY opens the door to 577.
Cycles suggest a correction starts in July so those are the downside pivots if we break Thursday’s gap with down side follow thru.